
Scenario 6
License

If you want to use the dataset or scripts on this page, please use the link below to generate the final list of papers that need to be cited.
Overview
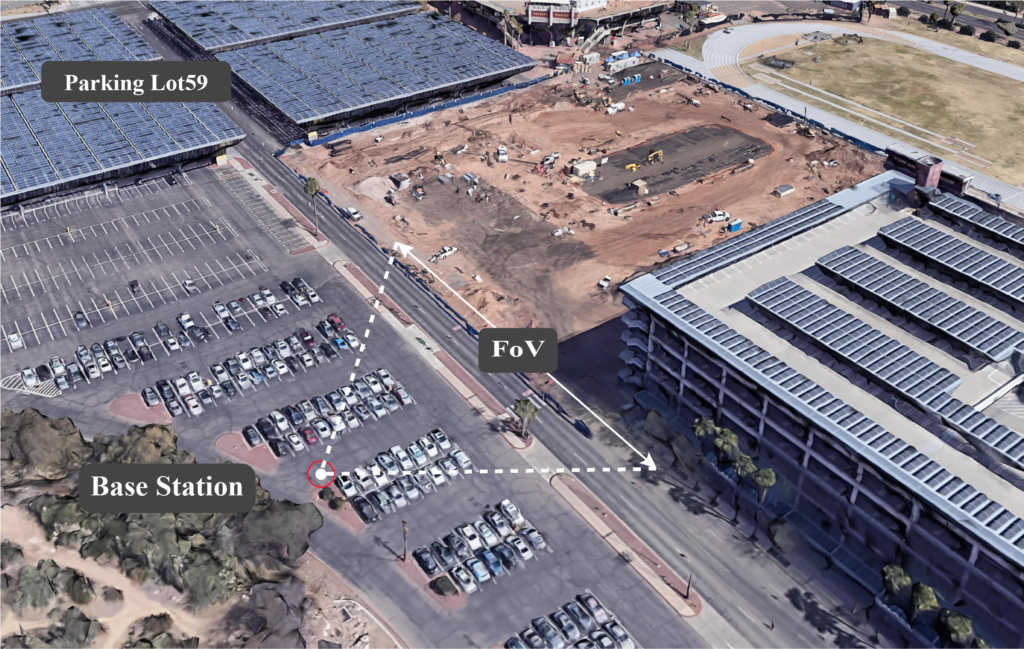
Scenario 6 emulates a Vehicle-to-Infrastructure (V2I) mmWave communication setup. The adopted testbed comprises of two units. Unit 1 primarily consists of a stationary base station equipped with an RGB camera and a mmWave phased array. The stationary unit adopts a 16-element 60GHz-band phased array and it receives the transmitted signal using an over-sampled codebook of 64 pre-defined beams. The second unit (Unit 2) is a mobile vehicle unit equipped with a mmWave transmitter and GPS receiver. The transmitter consists of a quasi-omni antenna constantly transmitting (omnidirectional) at the 60 GHz band. Please refer to the detailed description of the testbed presented here.
Parking Lot59: Most of the scenarios in DeepSense 6G mostly constitute busy downtown streets or streets crossing through the university campus. Although they present a variety of interesting scenes, including vehicles, people, etc., the distance of the basestation from the transmitter is on average around ~20 meters. The constraints of the individual location prevent from increasing this distance any further. Since the FoV of the camera and the phased arrays are fixed, as the distance of the basestation from the street increases, it helps in capturing a wider view of the street. The lot-59 parking lot is one such location. It is a 4-lane street without a passing lane in between and a speed limit of 35 mph. However, the average distance of the basestation from the transmitter is around 65 meters providing a very wide view of the street in the FoV of the basestation. All of these features make this scenario diverse from both visual and wireless perspectives.
Collected Data
Overview
Number of Data Collection Units: 2 (using DeepSense Testbed #1)
Number of Data Samples: 915
Data Modalities: RGB images, 64-dimensional received power vector, GPS locations
Average Data Capture Rate: 7.21 FPS
Sensors at Unit 1: (Stationary Receiver)
- Wireless Sensor [Phased Array]: A 16-element antenna array operating in the 60 GHz frequency band and receives the transmitted signal using an over-sampled codebook of 64 pre-defined beams
- Visual Sensor [Camera]: The main visual perception element in the testbed is an RGB-D camera. The camera is used to capture RGB images of 960×540 resolution at a base frame rate of 30 frames per second (fps)
- Position Sensor [GPS Receiver]: A GPS-RTK receiver for capturing accurate real-time locations for the stationary unit
Sensors at Unit 2: (Mobile Transmitter)
- Position Sensor [GPS Receiver]: A GPS-RTK receiver is installed on the top of the mobile unit and is used to capture accurate real-time locations at 10 frames per second (fps). The collected data comprises the Latitude and Longitude information in addition to other important data.
| Testbed | 1 |
|---|---|
| Instances | 915 |
| Number of Units | 2 |
| Total Data Modalities | RGB images, 64-dimensional received power vector, GPS locations |
| Unit1 | |
| Type | Stationary |
| Hardware Elements | RGB camera, mmWave phased array receiver, GPS receiver |
| Data Modalities | RGB images, 64-dimensional received power vector, GPS locations |
| Unit2 | |
| Type | Mobile |
| Hardware Elements | mmWave omni-directional transmitter, GPS receiver |
| Data Modalities | GPS locations |
Data Visualization
Download
How to Access Scenario 6 Data?
Step 1. Download Scenario 6 Data
Step 2. Extract the scenario6.zip file
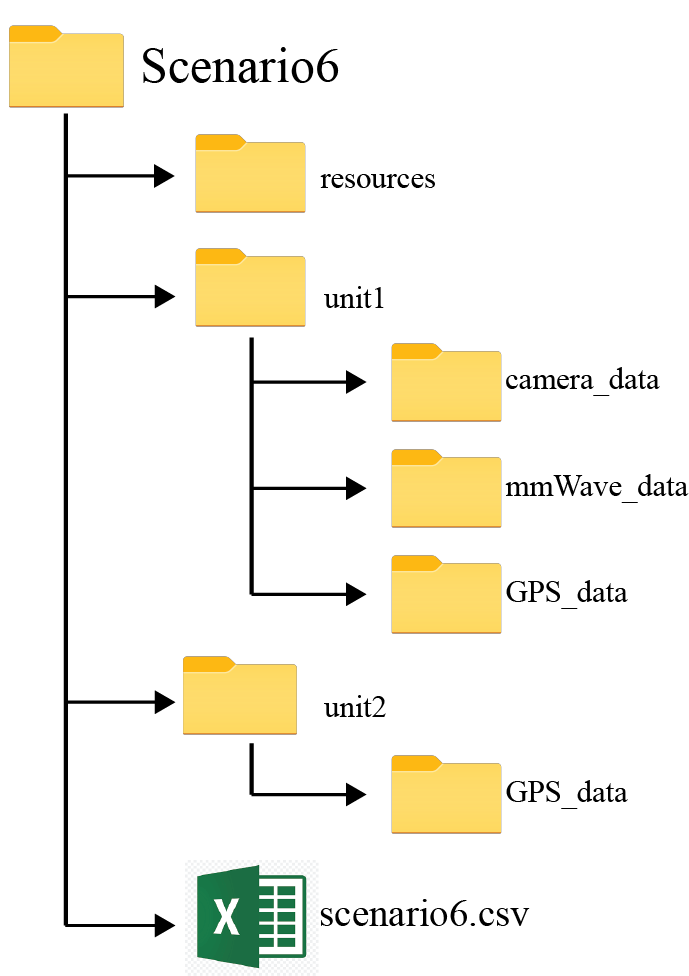
Scenario 6 folder consists of three sub-folders:
- unit1: Includes the data captured by unit 1
- unit2: Includes the data captured by unit 2
- resources: Includes the scenario-specific annotated dataset, data labels and other additional information. For more details, refer the resources section below.
Scenario 6 folder also includes the “scenario6.csv” file with the paths to all the collected data. For each coherent time, we provide the corresponding visual, wireless and GPS data.
Resources
What are the Additional Resources?
Resources consist of the following information:
- visual data annotations: For the visual data, we provide the coordinates of the 2D bounding box and attributes for each frame
- data labels: The labels comprises of the ground-truth beam indices computed from the mmWave received power vectors, the direction of travel (unit2), and the sequence index
- additional information: Includes the scenario-specific additional data. Details of the information is provided below
Visual Data Annotations
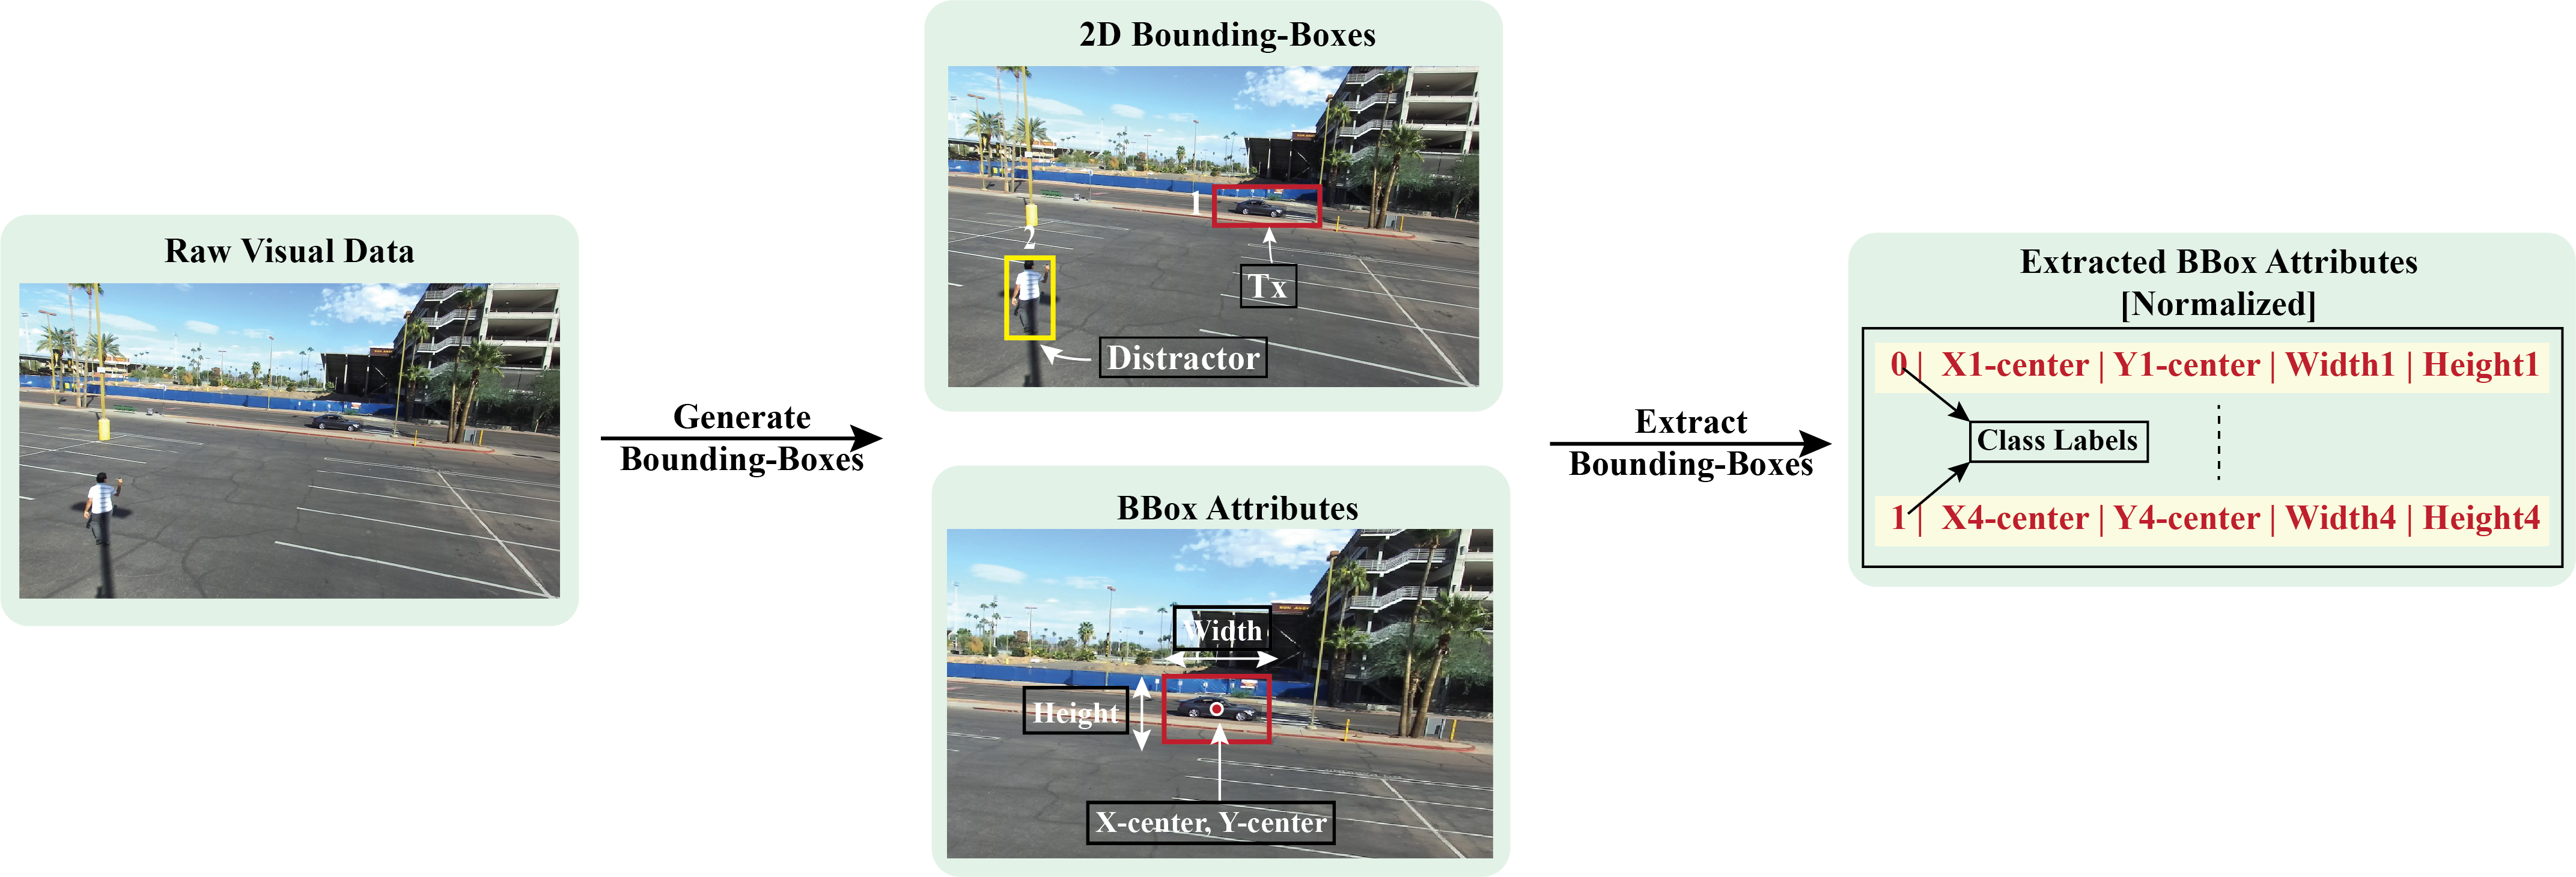
After performing the post-processing steps presented here, we generate the annotations for the visual data. Using state-of-the-art machine learning algorithms and multiple validation steps, we achieve highly accurate annotations. In this particular scenario, we provide the coordinates of the 2D bounding box and attributes for each frame. We, also, provide the ground-truth labels for 2 object classes, “Tx”, and “Distractor”. The “Tx” refers to the transmitting vehicle in the scene and “Distractor” for any other objects, such as human, other vehicles, etc. We follow the YOLO format for the bounding-box information. In the YOLO format, each bounding box is described by the center coordinates of the box and its width and height. Each number is scaled by the dimensions of the image; therefore, they all range between 0 and 1. Instead of category names, we provide the corresponding integer categories. We follow the following assignment: (i) “Tx” as “0” , and (ii) “Distractor” as “1”.
Data Labels
The labels comprises of the ground-truth beam indices computed from the mmWave received power vectors, the direction of travel (unit2), and the sequence index.
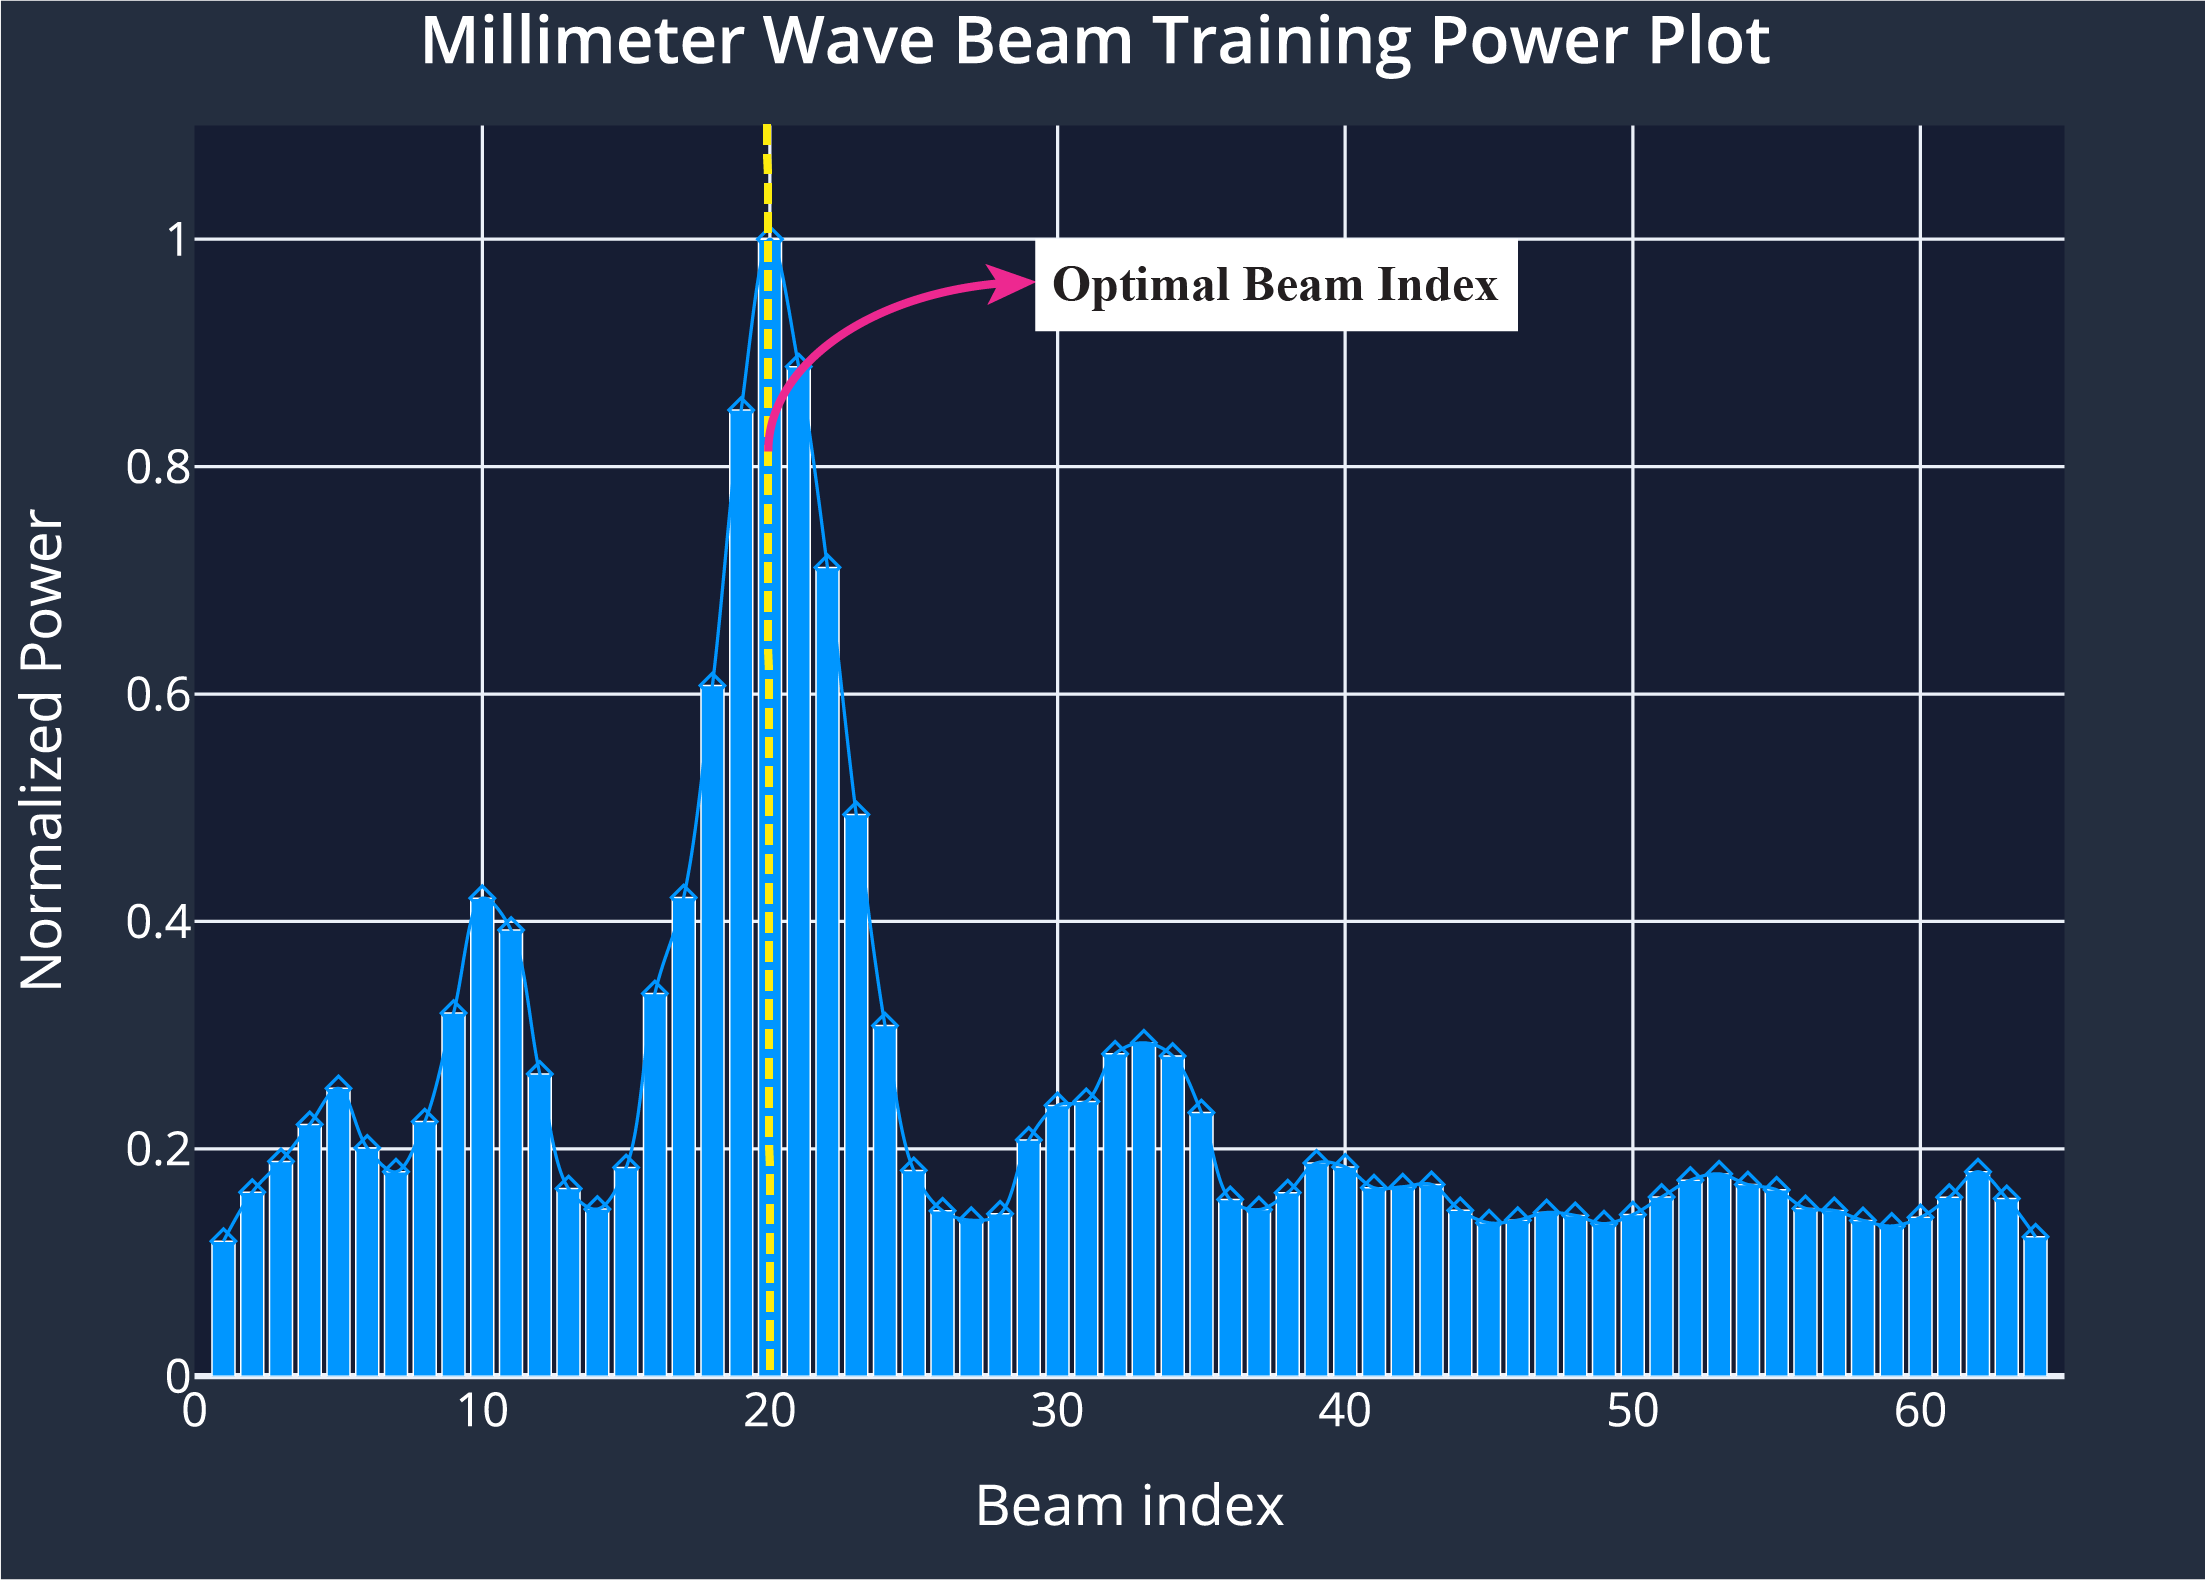
- Ground-Truth Beam: The phased array of unit 1 utilizes an over-sampled beamforming codebook of N = 64 vectors, which are designed to cover the field of view. It captures the received power by applying the beamforming codebook elements as a combiner. For each received power vector of dimension [64 x 1], the index with the maximum received power value is selected as the optimal beam index. This data is provided in the column 7 [‘unit1_beam_index’] of the scenario6.csv
- Sequence Index: During the data collection process, the mobile transmitter (unit2) travelled multiple times in front of the base station (unit1). For each run, the testbed collects multiple data samples. All the data samples with the same sequence index belongs to the same run
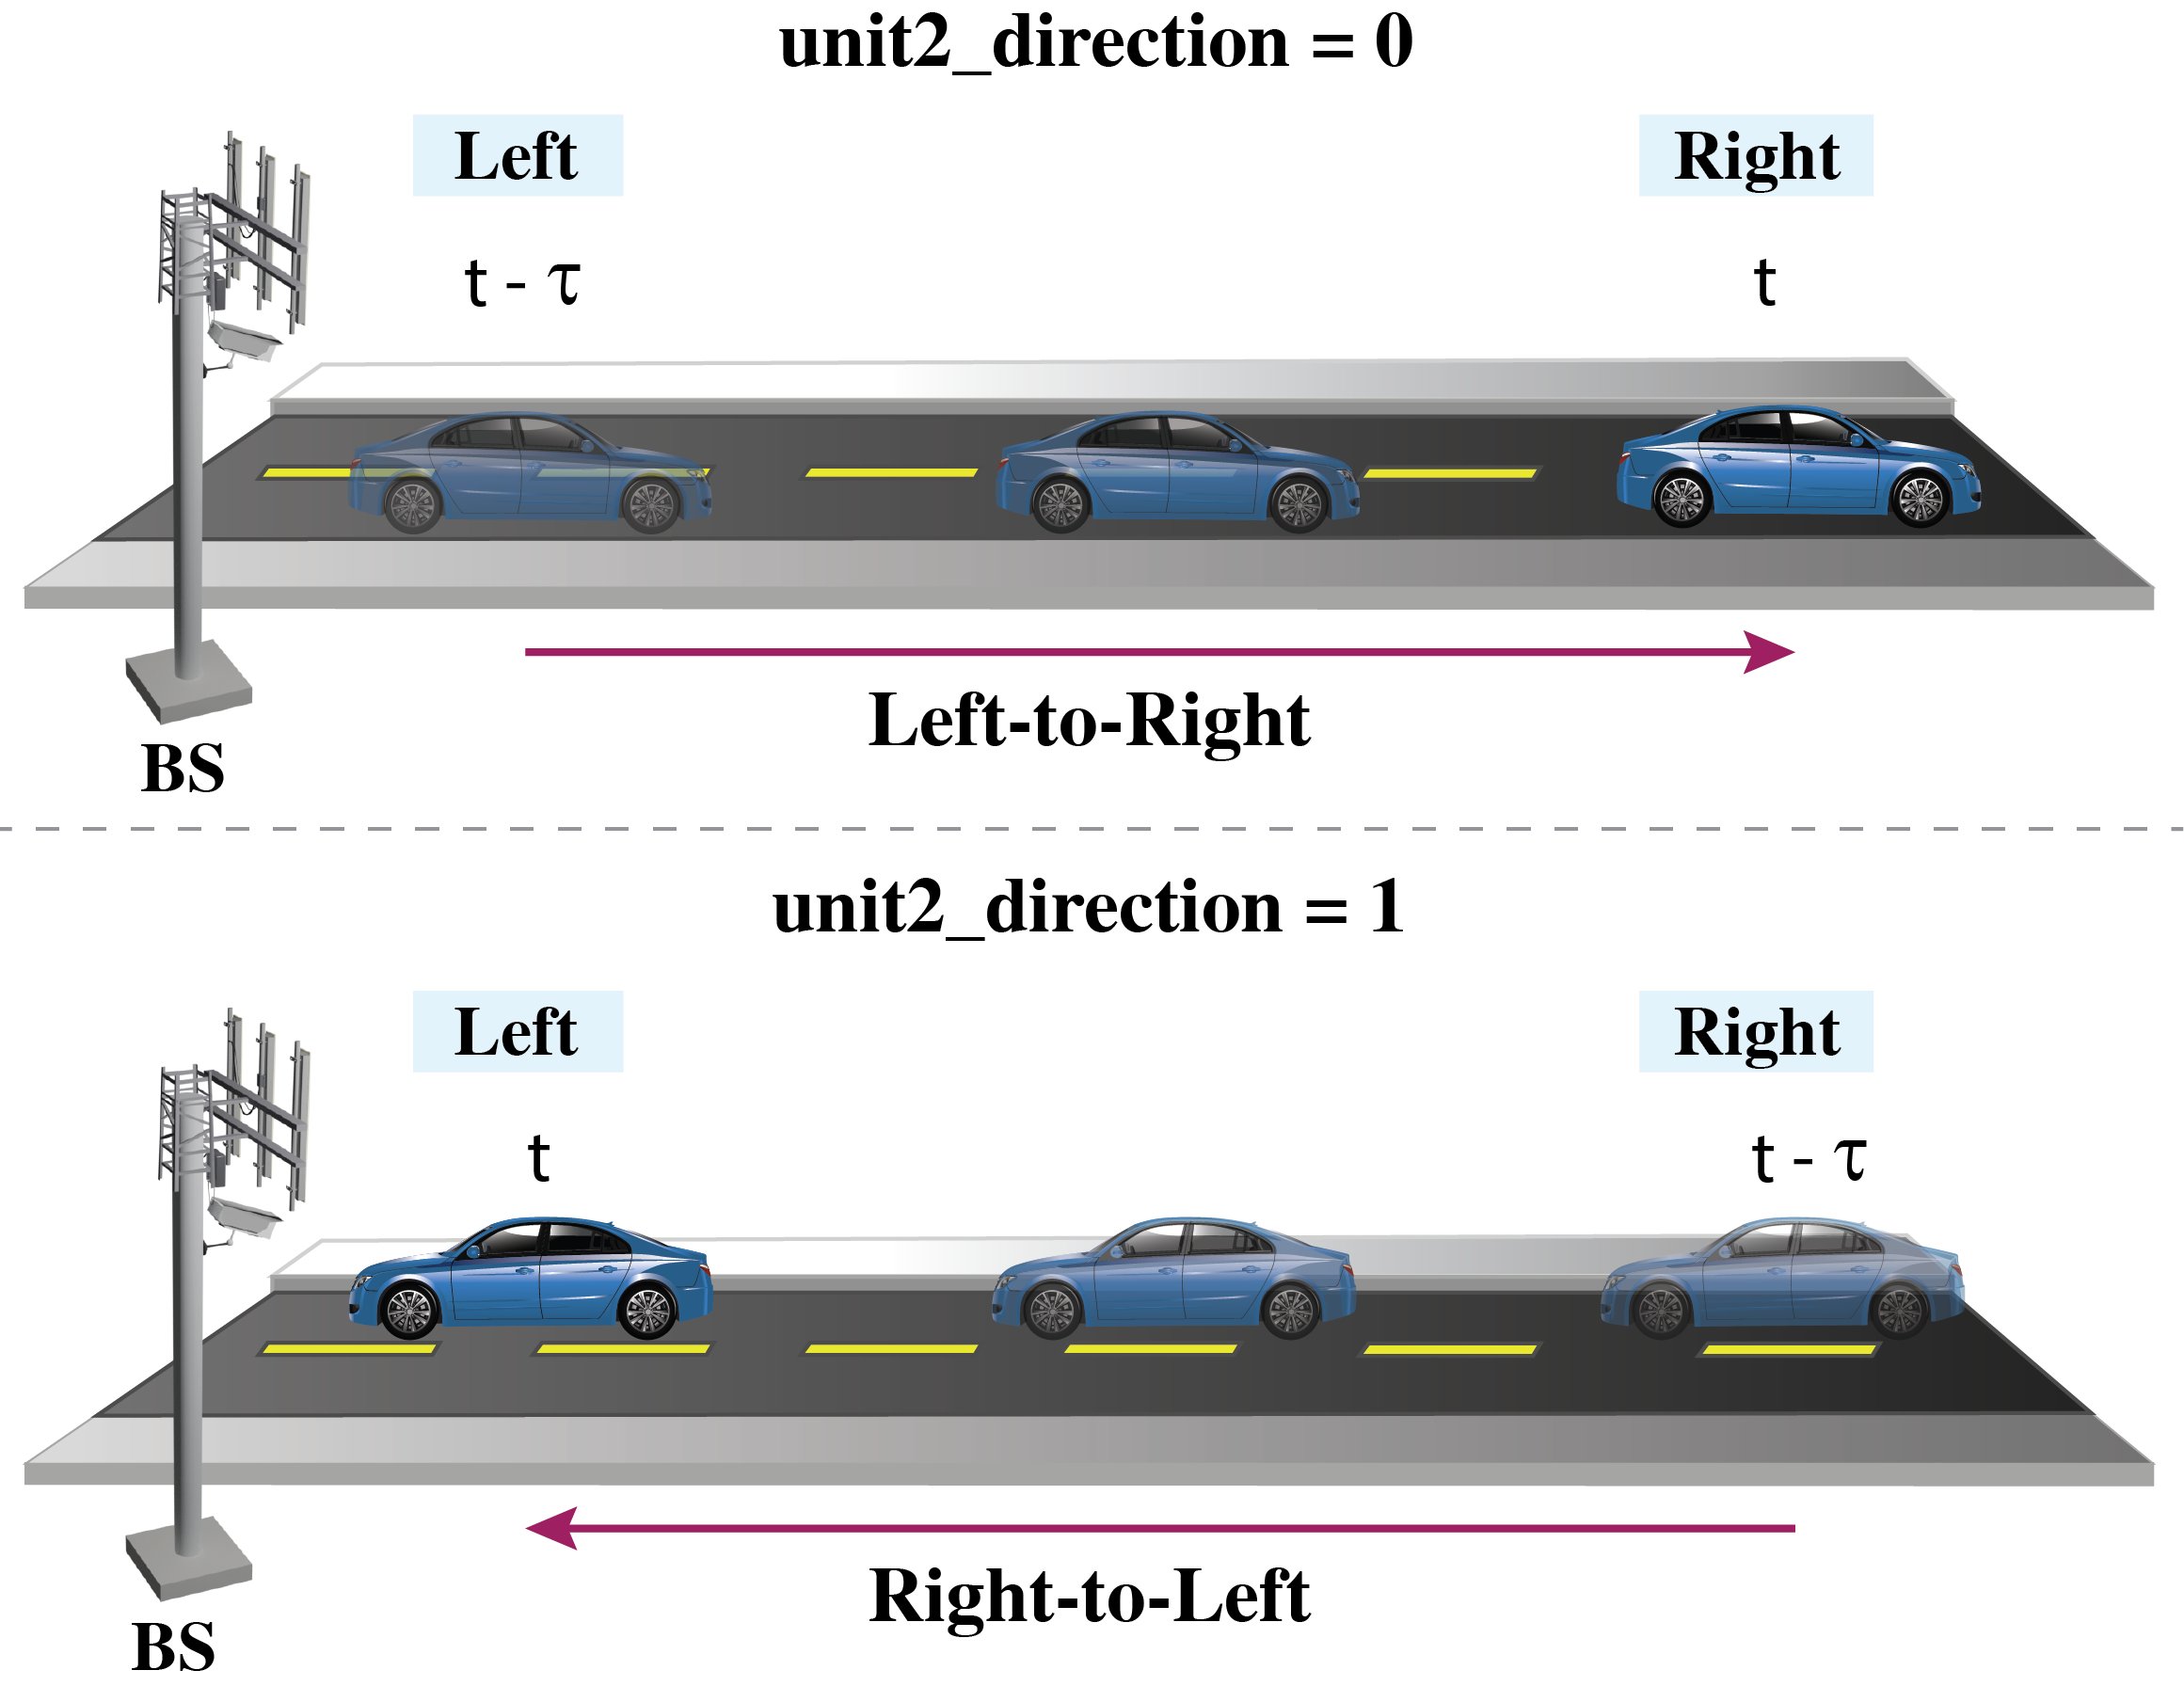
- Direction of Travel: For this scenario, during the data collection process, the mobile unit generally moves either from left-to-right or right-to-left of the base station. Here “0” represents the left-to-right movement of the transmitter and “1” represents the “right-to-left” movement. The movement is measured is from the point of view of the base station. This is provided in the ‘unit2_direction’ column of the csv
Additional Information
We, further, provide additional information for each sample present in the scenario dataset. The details are provided in the columns 8 – 16 of the scenario1.csv. The contents of the additional data is listed below:
- index: It represents the sample number
- time_stamp[UTC]: This represents the time of data capture in “hr-mins-secs-ms” format
- unit2_num_sat: For each data sample, it is an integer value representing the number of connected satellites at that time instant
- unit2_sat_used: At each time instant, these were the satellites that the receiver was connected
- unit2_fix_type: This shows whether or not there was a 3D fix. A 3D (three dimensional) position fix includes horizontal coordinates plus altitude. It requires a minimum of four visible satellites
- unit2_DGPS: Binary indicator representing whether or not there was Differential GPS was used
- unit2_PDOP: PDOP (position dilution of precision) describes the error caused by the relative position of the GPS satellites
- unit2_HDOP: HDOP represents the horizontal dilution of precision
An example table comprising of the data labels and the additional information is shown below.
| index | unit1_beam_index | seq_index | time_stamp[UTC] | unit2_direction | unit2_num_sat | unit2_sat_used | unit2_fix_type | unit2_DGPS | unit2_PDOP | unit2_HDOP |
|---|---|---|---|---|---|---|---|---|---|---|
| 1 | 6 | 1 | ['20-20-21-0'] | 0 | 25 | G1 G3 G10 G11 G21 G22 G25 G26 G31 G32 R1 R7 R8 R9 R10 R11 R23 R24 E7 E12 E19 E21 E26 E27 E30 | 3D | No | 0.5 | 1.1 |
| 2 | 4 | 1 | ['20-20-21-125'] | 0 | 25 | G1 G3 G10 G11 G21 G22 G25 G26 G31 G32 R1 R7 R8 R9 R10 R11 R23 R24 E7 E12 E19 E21 E26 E27 E30 | 3D | No | 0.5 | 1.1 |
| 3 | 5 | 1 | ['20-20-21-250'] | 0 | 25 | G1 G3 G10 G11 G21 G22 G25 G26 G31 G32 R1 R7 R8 R9 R10 R11 R23 R24 E7 E12 E19 E21 E26 E27 E30 | 3D | No | 0.5 | 1.1 |
| 4 | 5 | 1 | ['20-20-21-375'] | 0 | 25 | G1 G3 G10 G11 G21 G22 G25 G26 G31 G32 R1 R7 R8 R9 R10 R11 R23 R24 E7 E12 E19 E21 E26 E27 E30 | 3D | No | 0.5 | 1.1 |
| 5 | 6 | 1 | ['20-20-21-500'] | 0 | 25 | G1 G3 G10 G11 G21 G22 G25 G26 G31 G32 R1 R7 R8 R9 R10 R11 R23 R24 E7 E12 E19 E21 E26 E27 E30 | 3D | No | 0.5 | 1.1 |
| 6 | 7 | 1 | ['20-20-22-0'] | 0 | 25 | G1 G3 G10 G11 G21 G22 G25 G26 G31 G32 R1 R7 R8 R9 R10 R11 R23 R24 E7 E12 E19 E21 E26 E27 E30 | 3D | No | 0.5 | 1.1 |
| 7 | 8 | 1 | ['20-20-22-125'] | 0 | 25 | G1 G3 G10 G11 G21 G22 G25 G26 G31 G32 R1 R7 R8 R9 R10 R11 R23 R24 E7 E12 E19 E21 E26 E27 E30 | 3D | No | 0.5 | 1.1 |
| 8 | 4 | 1 | ['20-20-22-250'] | 0 | 25 | G1 G3 G10 G11 G21 G22 G25 G26 G31 G32 R1 R7 R8 R9 R10 R11 R23 R24 E7 E12 E19 E21 E26 E27 E30 | 3D | No | 0.5 | 1.1 |
| 9 | 7 | 1 | ['20-20-22-375'] | 0 | 25 | G1 G3 G10 G11 G21 G22 G25 G26 G31 G32 R1 R7 R8 R9 R10 R11 R23 R24 E7 E12 E19 E21 E26 E27 E30 | 3D | No | 0.5 | 1.1 |
| 10 | 8 | 1 | ['20-20-22-500'] | 0 | 25 | G1 G3 G10 G11 G21 G22 G25 G26 G31 G32 R1 R7 R8 R9 R10 R11 R23 R24 E7 E12 E19 E21 E26 E27 E30 | 3D | No | 0.5 | 1.1 |