Multi Modal V2V Beam Prediction Challenge 2023
Leaderboard
- This table documents the overall DBA Score achieved by the different solutions along with the individual scores for different scenarios.
- For further details and information regarding the ML challenge and how to participate, please check the “ML Challenge” section below.
Congratulations!

Beamwise
APL: -6.26 dB

Hyperion
APL: -7.08 dB

Yasr
APL: -9.52 dB
Updates
With 35 teams participating, the WI-Lab-ITU Multi-Modal V2V Beam Prediction Challenge 2023 has concluded for the current year, 2023.
We have incorporated a new ML challenge task (separated from this competition) for anyone interested in working on this important machine learning task. Please refer to the link provided below to access the task dataset and submit your results.
Stay tuned for another interesting competition in 2024!
Introduction
Vehicle-to-vehicle (V2V) communication is essential in intelligent transportation systems (ITS) for enabling vehicles to exchange critical information, enhancing safety, traffic efficiency, and the overall driving experience. However, traditional methods of V2V communication face difficulty handling the growing volume and complexity of data, which might limit the effectiveness of ITS. To navigate this challenge, the exploration of higher frequency bands, such as millimeter wave (mmWave) and sub-terahertz (sub-THz) frequencies, is becoming increasingly crucial. These higher frequency bands offer larger bandwidths, presenting an apt solution to cater to the escalating data rate demands inherent in V2V communication systems.
However, this transition brings its own challenges. The high-frequency systems need to deploy large antenna arrays at the transmitters and/or receivers and use narrow beams to guarantee sufficient receiver power. Finding the best beams (out of a pre-defined codebook) at the transmitter and receiver is associated with high beam training overhead (search time to find/align the best beams). This challenge, therefore, presents a critical bottleneck, particularly for high-mobility, latency-sensitive V2V applications, marking the next frontier in V2V communication: effective and efficient V2V beam prediction.
Sensing aided beam prediction is a promising solution: The dependence of mmWave/THz communication systems on the LOS links between the transmitter/receiver means that the awareness about their locations and the surrounding environment (geometry of the buildings, moving scatterers, etc.) could potentially help the beam selection process. To that end, the sensing information of the environment and the UE could be utilized to guide the beam management and reduce beam training overhead significantly. For example, the sensory data collected by the RGB cameras, LiDAR, Radars, GPS receivers, etc., can enable the transmitter/receiver decide on where to point their beams (or at least narrow down the candidate beam steering directions).
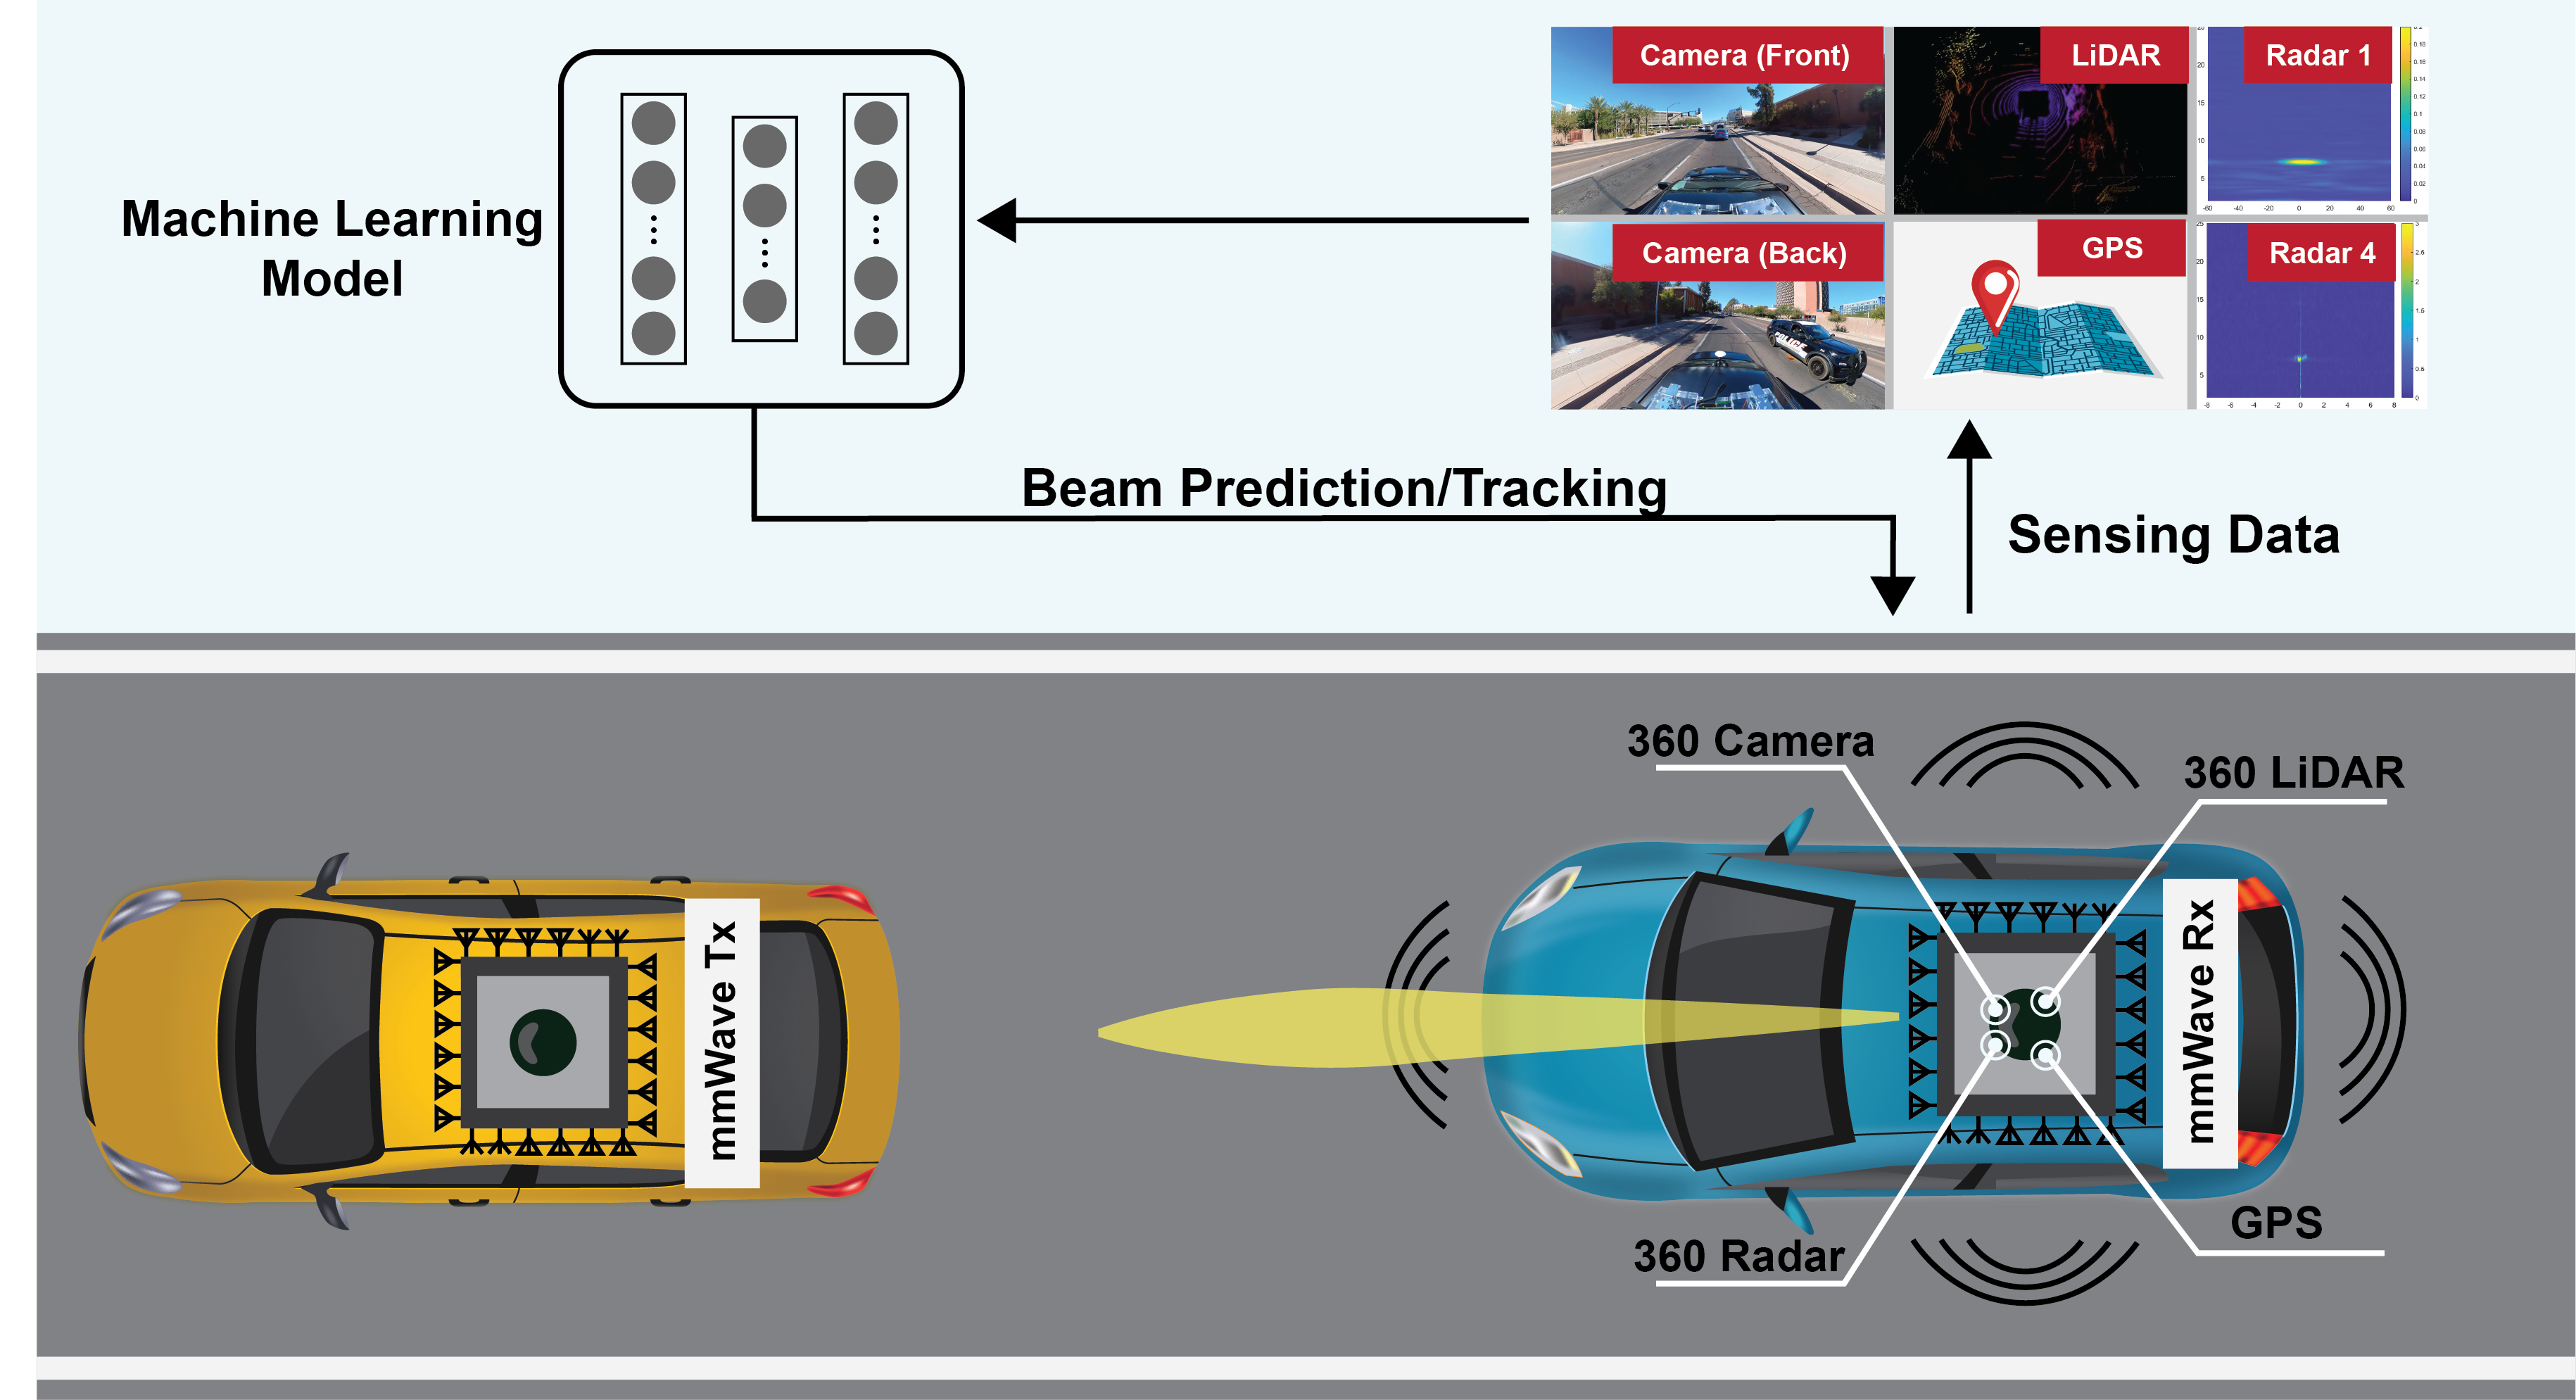
Figure 1: Representation of the sensing-aided beam prediction task targeted in this challenge
Problem Statement
This ML challenge targets addressing the novel domain of sensing-aided beam prediction specifically designed for Vehicle-to-Vehicle (V2V) communication. In particular, the task calls for the development of machine learning-based solutions that can leverage a multi-modal sensing dataset featuring visual and positional data modalities in a V2V scenario to predict the current/future optimal mmWave beam index.
General Objective: Given a multi-modal training dataset comprising sequences of 360-degree RGB images and vehicle positions from different locations with diverse environmental characteristics, the goal is to design machine learning models capable of accurate sensing-aided V2V beam tracking.
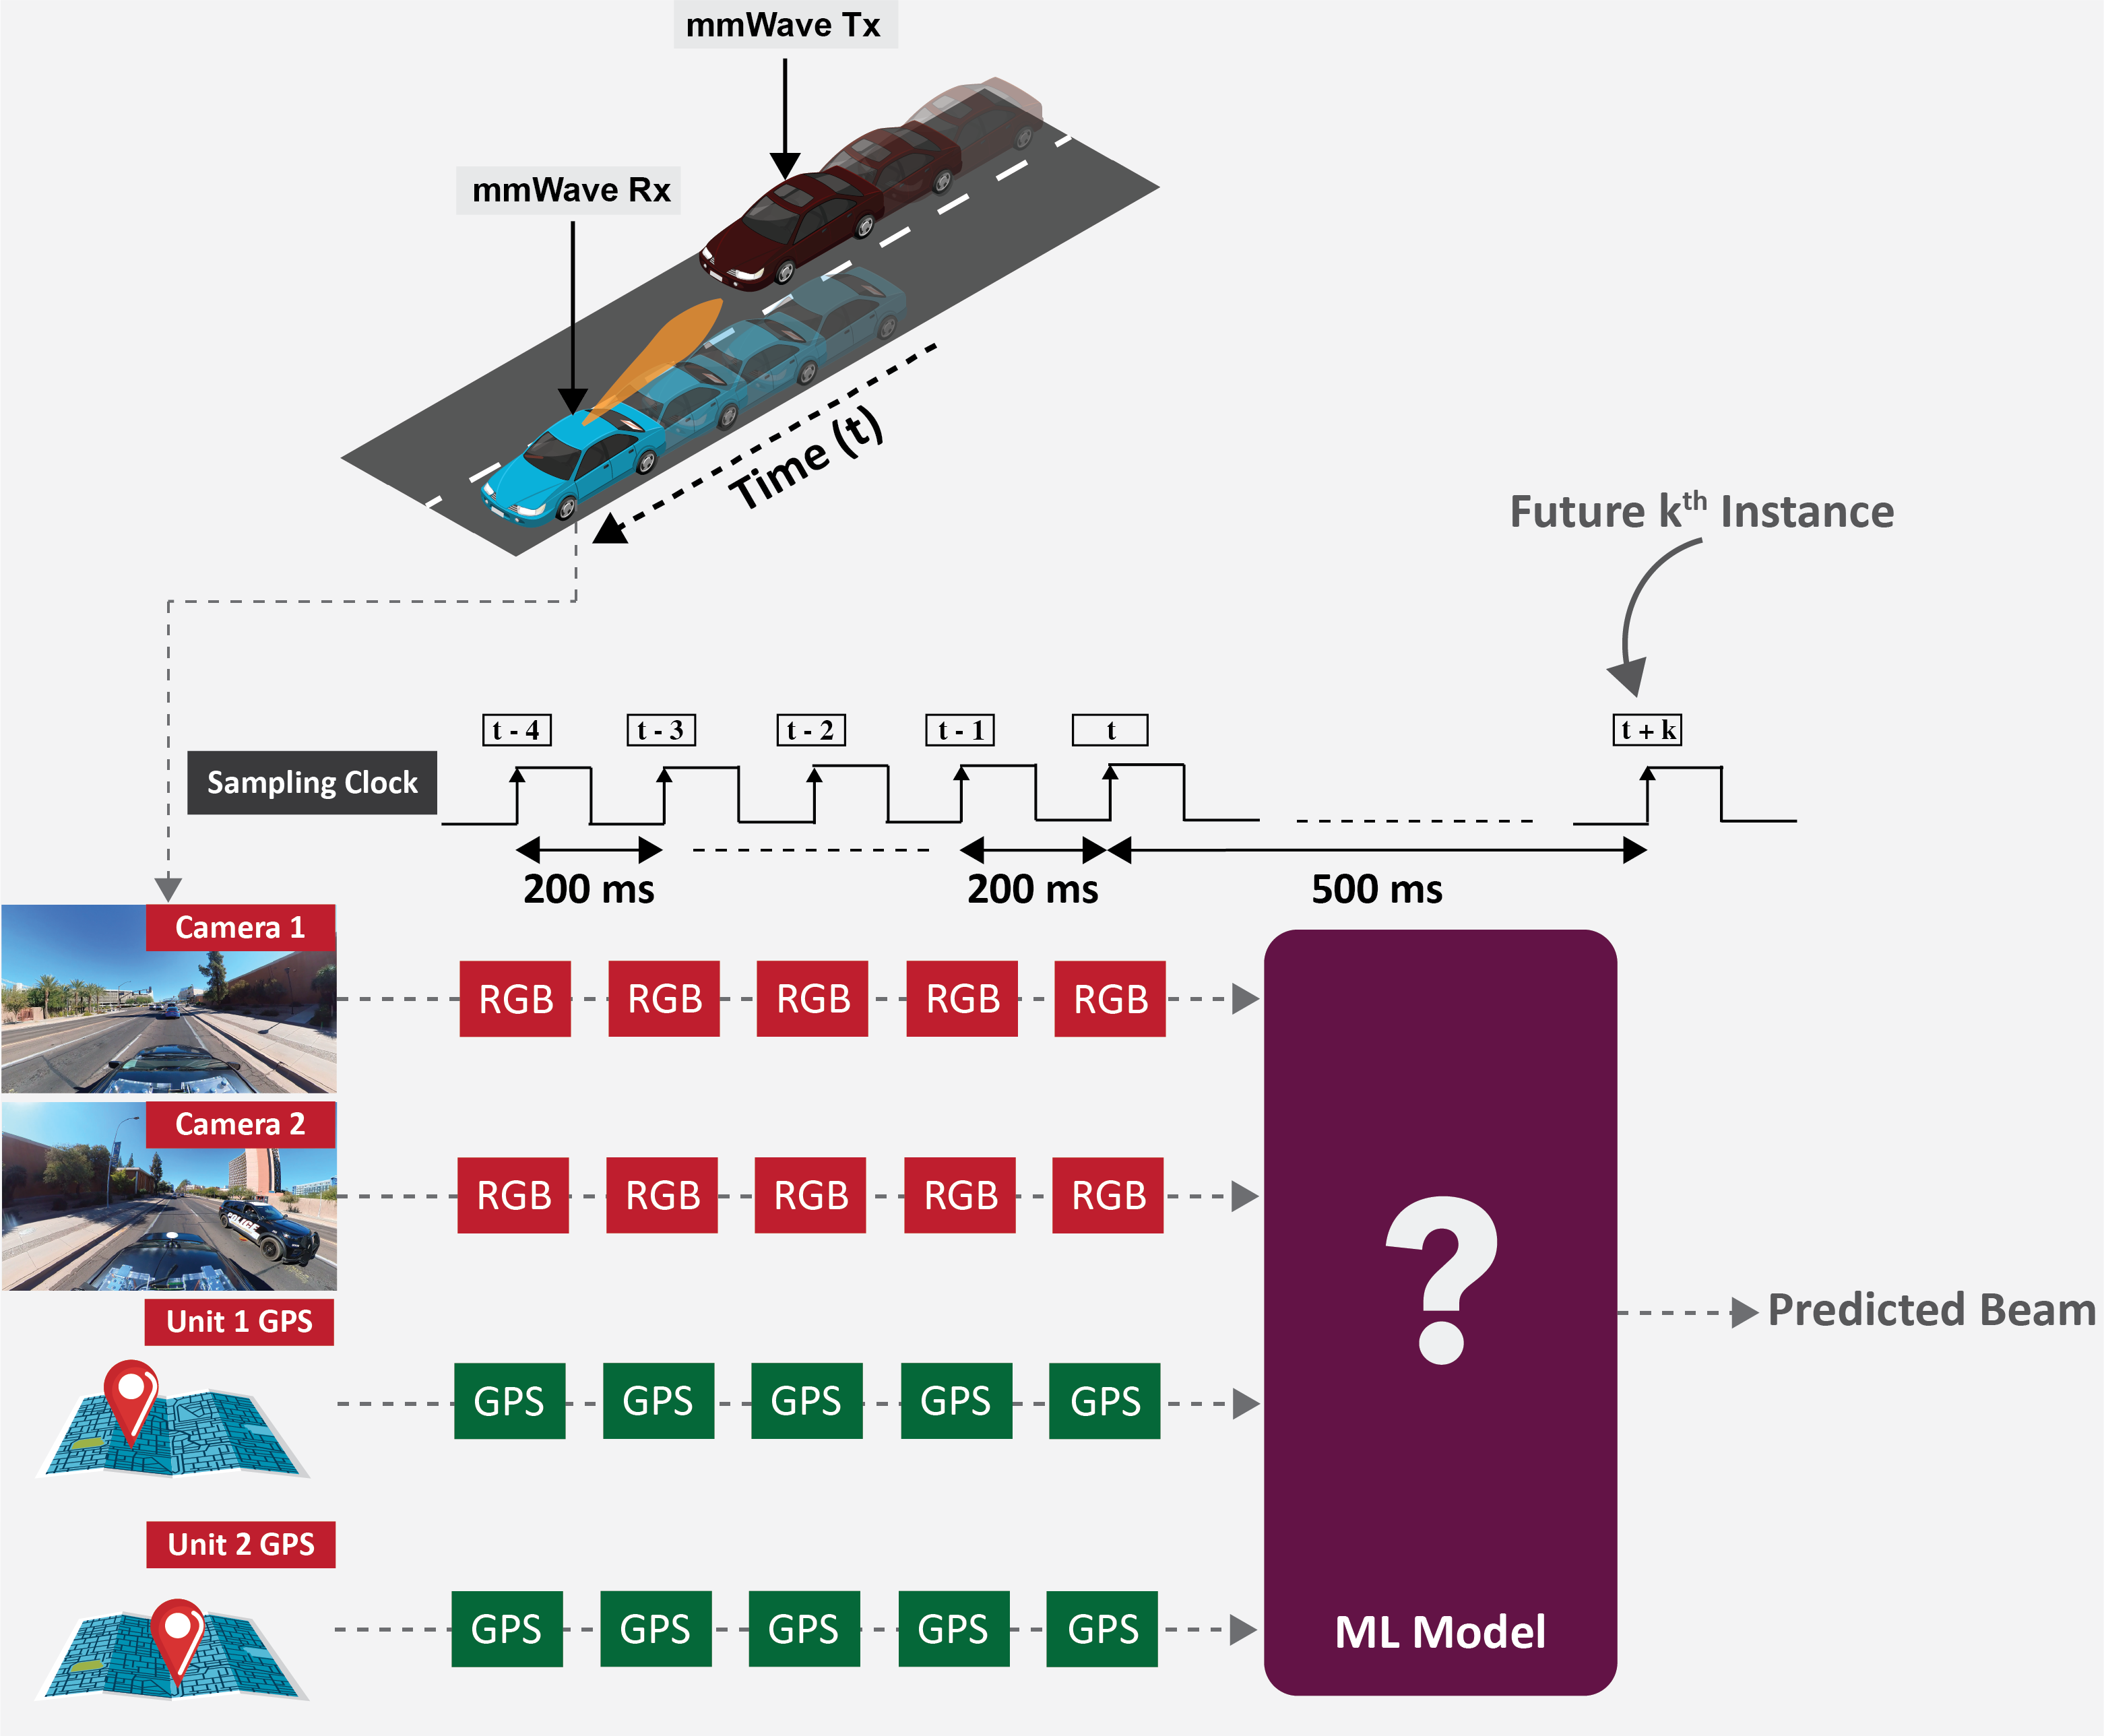
Figure 2: Schematic representation of the input data sequence utilized in this challenge tasks
Problem Statement: As demonstrated in Fig. 2, the provided input data for the models is the following:
- A sequence of 5 samples from the 360-degree camera installed at the top of the receiver vehicle (Unit 1). The samples are provided as two separate 180-degree images representing the front and rear views of the vehicle.
- A sequence of 5 samples from the GPS installed in the two vehicles (Unit 1 and Unit 2).
Each input sample is spaced 200 ms apart and in total four files will be provided for each sample (two images and two GPS positions). Participants are asked to provide a prediction of the optimal beam 500 ms after the last input sample.
Participants are encouraged to utilize both data modalities, vision and position data. However, they are free to choose either one or both according to their strategic considerations.
Developing efficient solutions for sensing-aided V2V beam tracking and accurately evaluating them requires the availability of a large-scale real-world dataset. With this motivation, we built the DeepSense 6G V2V dataset, the first large-scale real-world multi-modal V2V dataset with co-existing communication and sensing data. Fig. 3 highlights the DeepSense 6G testbed and the overall data collection and post-processing setup.
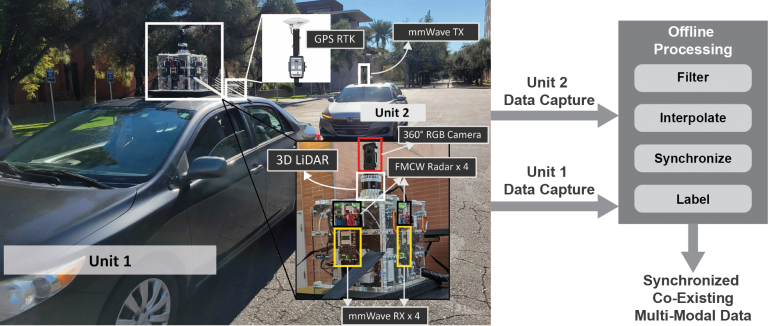
Figure 3: This figure presents the data collection testbed and the post-processing steps utilized to generate the final development dataset
DeepSense 6G Scenarios
In this challenge, the development/challenge datasets were built based on the DeepSense data from the V2V scenarios 36 – 39. In this section we describe briefly the V2V DeepSense scenarios and we encourage participants to visualize the data with the videos below. For additional contextual information and statistics about the data follow the link below.
As presented in Fig. 3, we utilize a two-vehicle testbed in the DeepSense6G V2V scenarios. The first unit, designated as the receiver, is equipped with an array of sensors, including four mmWave phased arrays facing different directions, a 360-degree RGB camera, four mmWave FMCW radars, a 3D LiDAR, and a GPS RTK kit. The second unit acts as the transmitter, possessing a mmWave quasi-omnidirectional antenna that remains oriented towards the receiver and a GPS receiver for capturing real-time position data. The resultant scenario dataset consists of the GPS position of both vehicles, 360-degree RGB images, radar and LiDAR data, and the corresponding 64×4 power vectors obtained by performing beam training with a 64-beam codebook at all the four receivers and a omnidirectional transmitter.
Development Dataset
The development dataset is a subset of the V2V dataset. In this section we describe in detail the data that participants will be provided and some key differences to the general V2V dataset described above. First, much like the V2V datasets, all data of the development dataset is indexed in a CSV. This CSV contains each training sequence and the expected output and it should be used to access the data to train ML models. Three aspects are worth mentioning about this training CSV:
- Sequencing: In the V2V dataset each row of the CSV corresponds to one sample of the dataset. In the development dataset, each row of the CSV corresponds to one sequence of data consisting of samples from different timesteps of the V2V dataset.
- Modalities: The Development dataset will only provide information on the modalities described in the problem statement and not include any other additional label or modality. This sub-dataset provides the respective modality data (position and vision) and the ground-truth best beam index.
- Sampling rate: The V2V scenarios have a stable sampling rate of 10 Hz, i.e., there is always 100 ms interval between the samples in the dataset. In this challenge, however, we use samples with different intervals. As described in the Problem Statement, 200 ms between input samples and 500 ms between the last training sample and the output value.
What does the Training CSV contain?
Each row of the CSV has one sequence. For each sequence we provide the scenario from which that the sequence was generated, 5 input samples (with the absolute index of the sample, 2 GPS positions and 2 images), and one output sample (with its absolute index and the overall beam index).
An example of the first 5 data samples is shown below.
| scenario | x1_unique_index | x1_unit1_gps1 | x1_unit2_gps1 | x1_unit1_rgb5 | x1_unit1_rgb6 | x2_unique_index | x2_unit1_gps1 | x2_unit2_gps1 | x2_unit1_rgb5 | x2_unit1_rgb6 | x3_unique_index | x3_unit1_gps1 | x3_unit2_gps1 | x3_unit1_rgb5 | x3_unit1_rgb6 | x4_unique_index | x4_unit1_gps1 | x4_unit2_gps1 | x4_unit1_rgb5 | x4_unit1_rgb6 | x5_unique_index | x5_unit1_gps1 | x5_unit2_gps1 | x5_unit1_rgb5 | x5_unit1_rgb6 | y1_unique_index | y1_unit1_overall-beam | y1_unit1_pwr1 | y1_unit1_pwr2 | y1_unit1_pwr3 | y1_unit1_pwr4 |
|---|---|---|---|---|---|---|---|---|---|---|---|---|---|---|---|---|---|---|---|---|---|---|---|---|---|---|---|---|---|---|---|
| 36 | 2674 | scenario36/unit1/gps1/gps_8869_11-46-31.233334.txt | scenario36/unit2/gps1/gps_33301_11-46-31.250000.txt | scenario36/unit1/rgb5/frame_11-46-31.205818.jpg | scenario36/unit1/rgb6/frame_11-46-31.205818.jpg | 2676 | scenario36/unit1/gps1/gps_8871_11-46-31.400000.txt | scenario36/unit2/gps1/gps_33303_11-46-31.416666.txt | scenario36/unit1/rgb5/frame_11-46-31.406020.jpg | scenario36/unit1/rgb6/frame_11-46-31.406020.jpg | 2678 | scenario36/unit1/gps1/gps_8873_11-46-31.600000.txt | scenario36/unit2/gps1/gps_33305_11-46-31.583333.txt | scenario36/unit1/rgb5/frame_11-46-31.606222.jpg | scenario36/unit1/rgb6/frame_11-46-31.606222.jpg | 2680 | scenario36/unit1/gps1/gps_8875_11-46-31.800000.txt | scenario36/unit2/gps1/gps_33308_11-46-31.833333.txt | scenario36/unit1/rgb5/frame_11-46-31.806424.jpg | scenario36/unit1/rgb6/frame_11-46-31.806424.jpg | 2682 | scenario36/unit1/gps1/gps_8877_11-46-32.000000.txt | scenario36/unit2/gps1/gps_33310_11-46-32.000000.txt | scenario36/unit1/rgb5/frame_11-46-32.006626.jpg | scenario36/unit1/rgb6/frame_11-46-32.006626.jpg | 2687 | 161 | scenario36/unit1/pwr1/pwr_11-46-31.859441.txt | scenario36/unit1/pwr2/pwr_11-46-31.859441.txt | scenario36/unit1/pwr3/pwr_11-46-31.859441.txt | scenario36/unit1/pwr4/pwr_11-46-31.859441.txt |
| 36 | 2675 | scenario36/unit1/gps1/gps_8870_11-46-31.300000.txt | scenario36/unit2/gps1/gps_33302_11-46-31.333333.txt | scenario36/unit1/rgb5/frame_11-46-31.305919.jpg | scenario36/unit1/rgb6/frame_11-46-31.305919.jpg | 2677 | scenario36/unit1/gps1/gps_8872_11-46-31.500000.txt | scenario36/unit2/gps1/gps_33304_11-46-31.500000.txt | scenario36/unit1/rgb5/frame_11-46-31.506121.jpg | scenario36/unit1/rgb6/frame_11-46-31.506121.jpg | 2679 | scenario36/unit1/gps1/gps_8874_11-46-31.700000.txt | scenario36/unit2/gps1/gps_33307_11-46-31.750000.txt | scenario36/unit1/rgb5/frame_11-46-31.706323.jpg | scenario36/unit1/rgb6/frame_11-46-31.706323.jpg | 2681 | scenario36/unit1/gps1/gps_8876_11-46-31.900000.txt | scenario36/unit2/gps1/gps_33309_11-46-31.916666.txt | scenario36/unit1/rgb5/frame_11-46-31.906525.jpg | scenario36/unit1/rgb6/frame_11-46-31.906525.jpg | 2683 | scenario36/unit1/gps1/gps_8879_11-46-32.133334.txt | scenario36/unit2/gps1/gps_33311_11-46-32.083333.txt | scenario36/unit1/rgb5/frame_11-46-32.106727.jpg | scenario36/unit1/rgb6/frame_11-46-32.106727.jpg | 2688 | 161 | scenario36/unit1/pwr1/pwr_11-46-31.959645.txt | scenario36/unit1/pwr2/pwr_11-46-31.959645.txt | scenario36/unit1/pwr3/pwr_11-46-31.959645.txt | scenario36/unit1/pwr4/pwr_11-46-31.959645.txt |
| 36 | 2676 | scenario36/unit1/gps1/gps_8871_11-46-31.400000.txt | scenario36/unit2/gps1/gps_33303_11-46-31.416666.txt | scenario36/unit1/rgb5/frame_11-46-31.406020.jpg | scenario36/unit1/rgb6/frame_11-46-31.406020.jpg | 2678 | scenario36/unit1/gps1/gps_8873_11-46-31.600000.txt | scenario36/unit2/gps1/gps_33305_11-46-31.583333.txt | scenario36/unit1/rgb5/frame_11-46-31.606222.jpg | scenario36/unit1/rgb6/frame_11-46-31.606222.jpg | 2680 | scenario36/unit1/gps1/gps_8875_11-46-31.800000.txt | scenario36/unit2/gps1/gps_33308_11-46-31.833333.txt | scenario36/unit1/rgb5/frame_11-46-31.806424.jpg | scenario36/unit1/rgb6/frame_11-46-31.806424.jpg | 2682 | scenario36/unit1/gps1/gps_8877_11-46-32.000000.txt | scenario36/unit2/gps1/gps_33310_11-46-32.000000.txt | scenario36/unit1/rgb5/frame_11-46-32.006626.jpg | scenario36/unit1/rgb6/frame_11-46-32.006626.jpg | 2684 | scenario36/unit1/gps1/gps_8880_11-46-32.200000.txt | scenario36/unit2/gps1/gps_33313_11-46-32.250000.txt | scenario36/unit1/rgb5/frame_11-46-32.206828.jpg | scenario36/unit1/rgb6/frame_11-46-32.206828.jpg | 2689 | 161 | scenario36/unit1/pwr1/pwr_11-46-32.059402.txt | scenario36/unit1/pwr2/pwr_11-46-32.059402.txt | scenario36/unit1/pwr3/pwr_11-46-32.059402.txt | scenario36/unit1/pwr4/pwr_11-46-32.059402.txt |
| 36 | 2677 | scenario36/unit1/gps1/gps_8872_11-46-31.500000.txt | scenario36/unit2/gps1/gps_33304_11-46-31.500000.txt | scenario36/unit1/rgb5/frame_11-46-31.506121.jpg | scenario36/unit1/rgb6/frame_11-46-31.506121.jpg | 2679 | scenario36/unit1/gps1/gps_8874_11-46-31.700000.txt | scenario36/unit2/gps1/gps_33307_11-46-31.750000.txt | scenario36/unit1/rgb5/frame_11-46-31.706323.jpg | scenario36/unit1/rgb6/frame_11-46-31.706323.jpg | 2681 | scenario36/unit1/gps1/gps_8876_11-46-31.900000.txt | scenario36/unit2/gps1/gps_33309_11-46-31.916666.txt | scenario36/unit1/rgb5/frame_11-46-31.906525.jpg | scenario36/unit1/rgb6/frame_11-46-31.906525.jpg | 2683 | scenario36/unit1/gps1/gps_8879_11-46-32.133334.txt | scenario36/unit2/gps1/gps_33311_11-46-32.083333.txt | scenario36/unit1/rgb5/frame_11-46-32.106727.jpg | scenario36/unit1/rgb6/frame_11-46-32.106727.jpg | 2685 | scenario36/unit1/gps1/gps_8881_11-46-32.300000.txt | scenario36/unit2/gps1/gps_33314_11-46-32.333333.txt | scenario36/unit1/rgb5/frame_11-46-32.306929.jpg | scenario36/unit1/rgb6/frame_11-46-32.306929.jpg | 2690 | 161 | scenario36/unit1/pwr1/pwr_11-46-32.160005.txt | scenario36/unit1/pwr2/pwr_11-46-32.160005.txt | scenario36/unit1/pwr3/pwr_11-46-32.160005.txt | scenario36/unit1/pwr4/pwr_11-46-32.160005.txt |
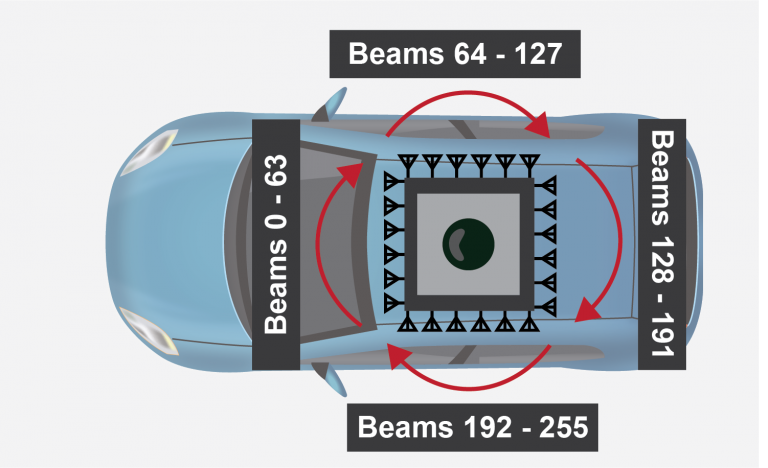
- Training Dataset: columns start with x1, x2, x3, x4, x5, or y1. These mark the sample in the sequence that is referred to in that column. Taking the example of the first input sample in the sequence, the columns of that sample would start with x1. In the training dataset, those columns would be: x1_unique_index, x1_unit1_gps1, x1_unit2_gps1, x1_unit1_rgb5, or x1_unit1_rgb6, respectively, for the absolute index of the sample, the GPS position of the receiver car, the GPS position of the transmitter car, the front 180º image and the back 180º of the receiver vehicle. For the 2nd input sample in the sequence, the columns start with x2, and so on until x5 for the last sample in the input sequence. Regarding output columns, they are y1_unique_index and y1_unit1_overall-beam. Columns with the keyword unique_index are further detailed in the V2V scenario pages (under abs_index). In essence, this index identifies the sample in the scenario. It indexes a specific moment /timestamp during the data collection of one scenario and is used in the videos to identify samples. The column y1_overall-beam represents the best overall beam used across all phased arrays. This is a value between 0 and 255, where 0 is the index of the leftmost beam of the front phased array, and 255 is the rightmost beam of the left phased array. Participants will be asked to predict beams in this precise format. The image to the right shows these beam indices.
- Test Dataset: The test dataset includes only the sequence of 5 input data samples, 5 vision, and position samples. Any labels or indices are hidden by design to promote a fair benchmarking process.
Baseline and Starter Script
Baseline Solution
To facilitate the start of the competition, we include a baseline script. The script uses Python, but the overall principles on how loading and manipulating the data are common to any programming language. The scripts first loads the GPS positions and RGB images. Then it uses the 5-sample input sequences to predict the optimal beam, like the proposed challenge. The script presents a simple and explainable beam tracking baseline using only the GPS positions and then outputs the prediction in the format expected in the competition and computes the scores.

Figure 4: Presents the proposed position-aided future beam prediction baseline solution using only classical methods.
The baseline approach can be split in three simple phases:
1. Use input positions to estimate car1 and car2 positions in the new timestamp (via linear extrapolation)
2. Use estimated positions to estimate angle of arrival
3. Use estimated angle of arrival to estimate optimal beam (assuming the beams are uniformly distributed in angular domain)
Further explanations are provided in the repository of the code. The baseline was applied to the four scenarios above (scenarios 36-39). The results follow below: the average power loss (APL) and top-k accuracy. These metrics will be computed for each submission, and the APL will be used to rank submissions. The APL metric is further detailed in the Evaluation Section of this page.
Regarding the performance of this baseline, the baseline is limited in several ways; for example, it considerably underperforms when both cars are static, which is common in traffic lights. It is up to the participants to design their approaches, borrowing or not from the baseline.
| Scenario | APL | Top1 | Top3 | Top5 |
|---|---|---|---|---|
| 36 | -4.81 dB | 31.18 | 62.6 | 70.41 |
| 37 | -4.10 dB | 24.05 | 58.6 | 70.47 |
| 38 | -8.12 dB | 10.69 | 32.2 | 45.57 |
| 39 | -8.02 dB | 22.45 | 49.18 | 60.34 |
| testset | -7.56 dB | 13.64 | 37.12 | 52.73 |
License
A. Alkhateeb, G. Charan, T. Osman, A. Hredzak, J. Morais, U. Demirhan, and N. Srinivas, “DeepSense 6G: A Large-Scale Real-World Multi-Modal Sensing and Communication Datasets,” available on arXiv, 2022. [Online]. Available: https://www.DeepSense6G.net
@Article{DeepSense,
author={Alkhateeb, Ahmed and Charan, Gouranga and Osman, Tawfik and Hredzak, Andrew and Morais, Joao and Demirhan, Umut and Srinivas, Nikhil},
title={DeepSense 6G: A Large-Scale Real-World Multi-Modal Sensing and Communication Dataset},
journal={IEEE Communications Magazine},
year={2023},
publisher={IEEE},}
J. Morais, G. Charan, N. Srinivas, and A. Alkhateeb, “DeepSense-V2V: A Vehicle-to-Vehicle Multi-Modal Sensing, Localization, and Communications Dataset,” available on arXiv, 2023. [Online]
@Article{DeepSense_V2V,
author = {Morais, J. and Charan, G. and Srinivas, N. and Alkhateeb, A.},
title = {DeepSense-V2V: A Vehicle-to-Vehicle Multi-Modal Sensing, Localization, and Communications Dataset},
journal = {to be available on arXiv},
year = {2023},}
Apart from the DeepSense and competition papers, please cite the papers which were the first to demonstrate beam prediction based on a large-scale real-world dataset (if you are using multiple modalities, please cite all the papers that correspond to these modalities).
- Position
@Article{JoaoPosition,
author = {Morais, J. and Behboodi, A. and Pezeshki, H. and Alkhateeb, A.},
title = {Position Aided Beam Prediction in the Real World: How Useful GPS Locations Actually Are?},
publisher = {arXiv},
doi = {10.48550/ARXIV.2205.09054},
url = {https://arxiv.org/abs/2205.09054},
year = {2022},}
- Vision
@INPROCEEDINGS{Charan2022,
author = {Charan, G. and Osman, T. and Hredzak, A. and Thawdar, N. and Alkhateeb, A.},
title = {Vision-Position Multi-Modal Beam Prediction Using Real Millimeter Wave Datasets},
booktitle={2022 IEEE Wireless Communications and Networking Conference (WCNC)},
year = {2022},}
Multi-Modal Development Dataset 2023
How to Access Task Data?
Step 1. Download the Development Data from the links above. For more robustness during the transfer, select download each file individually.
Step 2. Download the Development CSV with the training sequences.
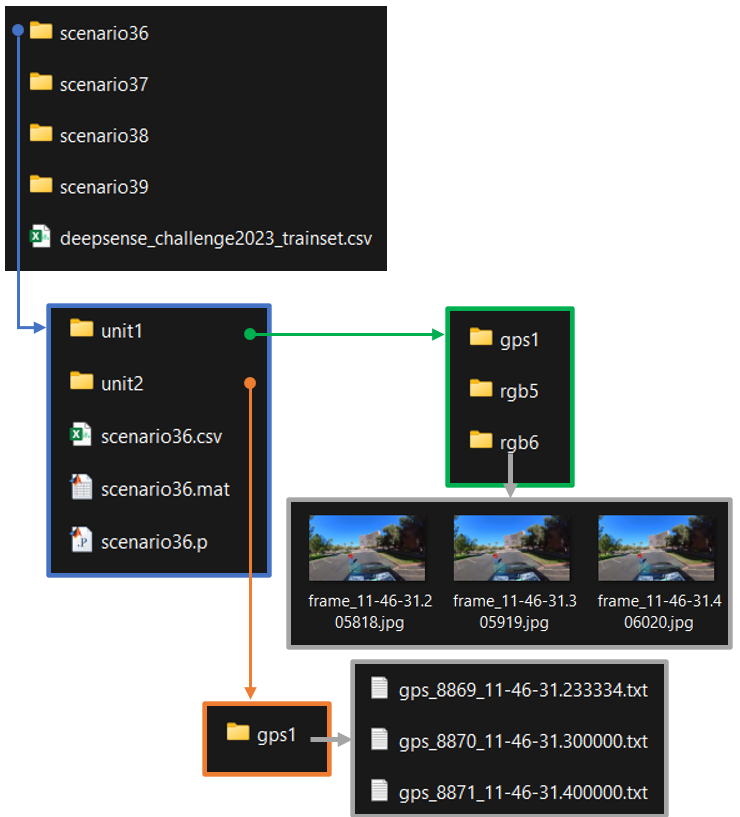
Step 3. Extract the zip files. First select all of them and use the tool 7ZIP to extract the parts. Move the main CSV (described below) to inside the scenario folders and keep the Development CSV outside. The image to the right shows the right structure. The V2V scenario pages also provide more information and in video format.
Each development dataset consists of following files:
- scenario folders: As mentioned earlier, the development dataset (provided for training and validation) comprises of data from the four DeepSense 6G scenarios, scenarios 36 to 39. Each of the scenario folder comprises of the following sub-folders:
- unit1: Includes the data captured by unit 1 (receiver vehicle). Includes gps1, rgb5 and rgb6 folders, respectively, for the GPS positions and the two 180º camera images.
- unit2: Includes data captured by unit 2 (transmitter vehicle), in this case, only its GPS position.
- scenarioX.csv: The csv file contains the scenario data. See more information about this scenario file in the scenario pages.
- scenarioX.p and scenarioX.mat: These are the pre-loaded dictionaries with the training data. They contain exactly the same data as the csv file above. They are not strictly necessary and their use is optional, however, as shown in the example script in the benchmark section, they can facilitate the access to the data.
Competition Process
Participation Steps
Step 1. Getting started: First, we recommend the following:
- Get familiarized with the data collection testbed and the different sensor modalities presented here
- In the Tutorials page, we have provided Python-based codes to load and visualize the different data modalities
Submission Process
Please submit your solutions to competition@deepsense6g.net
The objective is to evaluate the beam tracking accuracy. For this objective, we will release the test set before the end of the competition. Participants should use their ML models to predict the optimal beam index for the test dataset and send the results in a CSV file. The following are complete requirements for a submission to be considered complete:
- A csv file called <group_name>_prediction.csv with a single column called “prediction” with the prediction values of the optimal beam index (an integer value between 0 and 255) for each sample in the test set. A sample submission csv file is included in the download of the training CSV file.
- A file <group_name>_code.zip with the evaluation code, any pre-trained models and a ReadMe file with the requirements to run the code. This file will be used for reproducibility purposes and any submission that cannot be reproduced won’t be considered valid.
- A brief PDF document <group_name>_document.pdf describing the proposed solution and how to reproduce it (1-3 pages).
If you have any questions, please post your question on the DeepSense Forum
Evaluation
Each submission will be ranked based on the average power loss (APL). This metric quantifies, on average, how much the received power decreases by using the recommended beam instead of the ground truth optimum beam.
Since the powers in the dataset are in linear units, the power loss between the optimum received power p and the received power of the estimated best beam p’ in dB is given by the formula to the side. This power loss is computed for all samples of the testset and then averaged, and the participant with the APL score closest to zero wins.
The optimum beam index is used to fetch the optimum received power and this index is hidden in the testset. The predicted beam index must be an integer and lie in the interval [0,255]. Our evaluation script will use these two beam indices to score each submission.
Rules
To participate in this challenge, the following rules must be satisfied:
- Participants can work in teams up to 4 members (i.e., 1-4 members). All the team members should be announced at the beginning (in the registration form) and will be considered to have an equal contribution.
- There are no constraints on the participants country (participants from all countries are invited).
- The participation is not limited to undergraduate students (graduate students are also invited).
- The participation is not limited to academia (participants from industry and government are also invited).
Timeline and Prizes
Timeline
- Registration: August 24, 2023 – October 31, 2023
- Release of the development dataset: August 24, 2023
- Release of the test dataset: October 28, 2023
- Submission deadline: November 10, 2023
- Final ranking (and announcing the winners): November 17, 2023
Prizes
- 1st winner: A cash prize of 700 CHF
- 2nd winner: A cash prize of 200 CHF
- 3rd winner: A cash prize of 100 CHF
Sponsored by

Sponsored by

Organizers


If you have any questions, please contact the organizers using competition@deepsense6g.net or post your question on the DeepSense Forum

