
Scenario 8
Overview
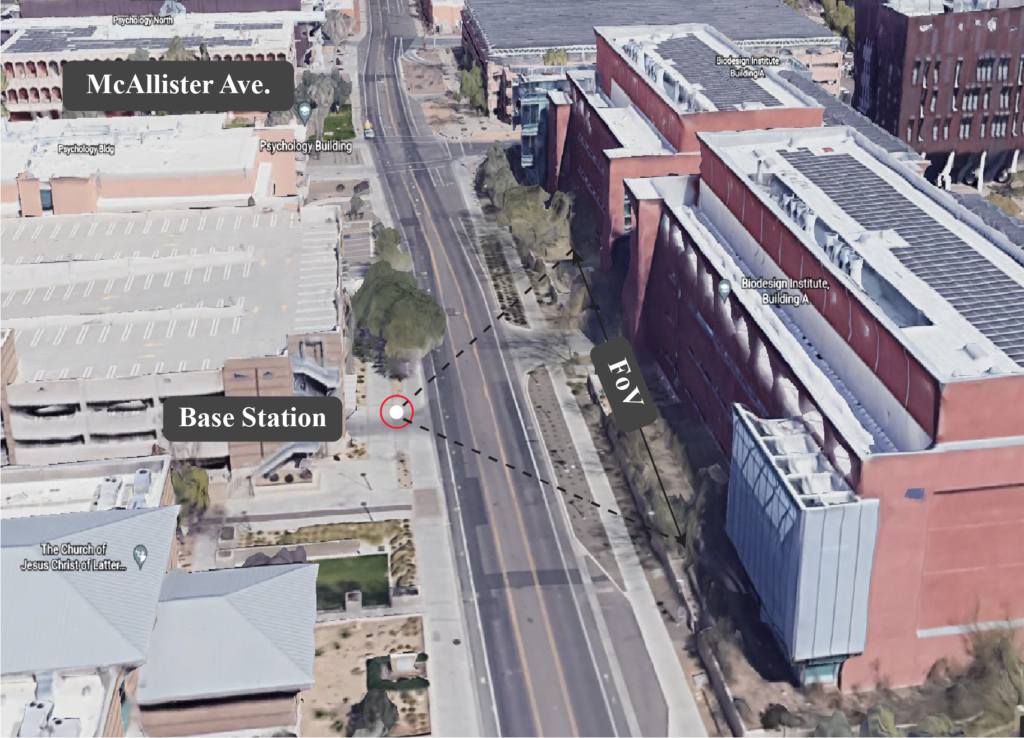
Scenario 8 emulates a Vehicle-to-Infrastructure (V2I) mmWave communication setup. The adopted testbed comprises of three units. Unit 1 primarily consists of a stationary base station equipped with an RGB camera and a mmWave phased array. The stationary unit adopts a 16-element 60GHz-band phased array and it receives the transmitted signal using an over-sampled codebook of 64 pre-defined beams. The second unit (Unit 2) is a mobile vehicle unit equipped with a mmWave transmitter and GPS receiver. The transmitter consists of a quasi-omni antenna constantly transmitting (omnidirectional) at 60 GHz band. Unit 3 is a 360 coverage LiDAR system, co-located with stationary base station. Please refer to the detailed description of the testbed presented here.
McAllister Ave: It is a two-way street with 2 lanes, a width of 10.6 meters, and a vehicle speed limit of 25mph (40.6 km per hour. It has a three-way intersection where most of the traffic takes place. This location has vehicle traffic and also footfall and cycling traffic. Around the intersection, vehicles could be seen driving through the street or driving into or out of the two parking structures located south and north of the intersection. All that variety of traffic makes the location diverse from visual and wireless perspectives alike.
Collected Data
Overview
Number of Data Collection Units: 2 (using DeepSense Testbed #1)
Number of Data Samples: 4043
Data Modalities: RGB images, 64-dimensional received power vector, GPS locations
Sensors at Unit 1: (Stationary Receiver)
- Wireless Sensor [Phased Array]: A 16-element antenna array operating in the 60 GHz frequency band and receives the transmitted signal using an over-sampled codebook of 64 pre-defined beams
- Visual Sensor [Camera]: The main visual perception element in the testbed is an RGB-D camera. The camera is used to capture RGB images of 960×540 resolution at a base frame rate of 30 frames per seconds (fps)
- Position Sensor [GPS Receiver]: A GPS-RTK receiver for capturing accurate real-time locations for the stationary unit.
- LiDAR Sensor [2D laser scanner]: This is a co-located system and it provides the range and angle data of objects within its range of view. This system covers a maximum range of 40 meters around the master component and it operates at a maximum scan rate of 10 Hz.
Sensors at Unit 2: (Mobile Transmitter)
- Position Sensor [GPS Receiver]: A GPS-RTK receiver installed on the top of the mobile unit and is used to capture accurate real-time locations at 10 frames per seconds (fps). The collected data comprises the Latitude and Longitude information in addition to other important data.
| Testbed | 1 |
|---|---|
| Instances | 4043 |
| Number of Units | 2 |
| Data Modalities | RGB images, 64-dimensional received power vector, GPS locations, LiDAR data |
| Unit1 | |
| Type | Stationary |
| Hardware Elements | RGB camera, mmWave phased array receiver, GPS receiver, LiDAR scanner |
| Data Modalities | RGB images, 64-dimensional received power vector, GPS locations |
| Unit2 | |
| Type | Mobile |
| Hardware Elements | mmWave omni-directional transmitter, GPS receiver |
| Data Modalities | GPS locations |
Data Visualization
Download
How to Access Scenario 8 Data?
Step 1. Download Scenario 8 Data
Step 2. Extract the scenario8.zip file
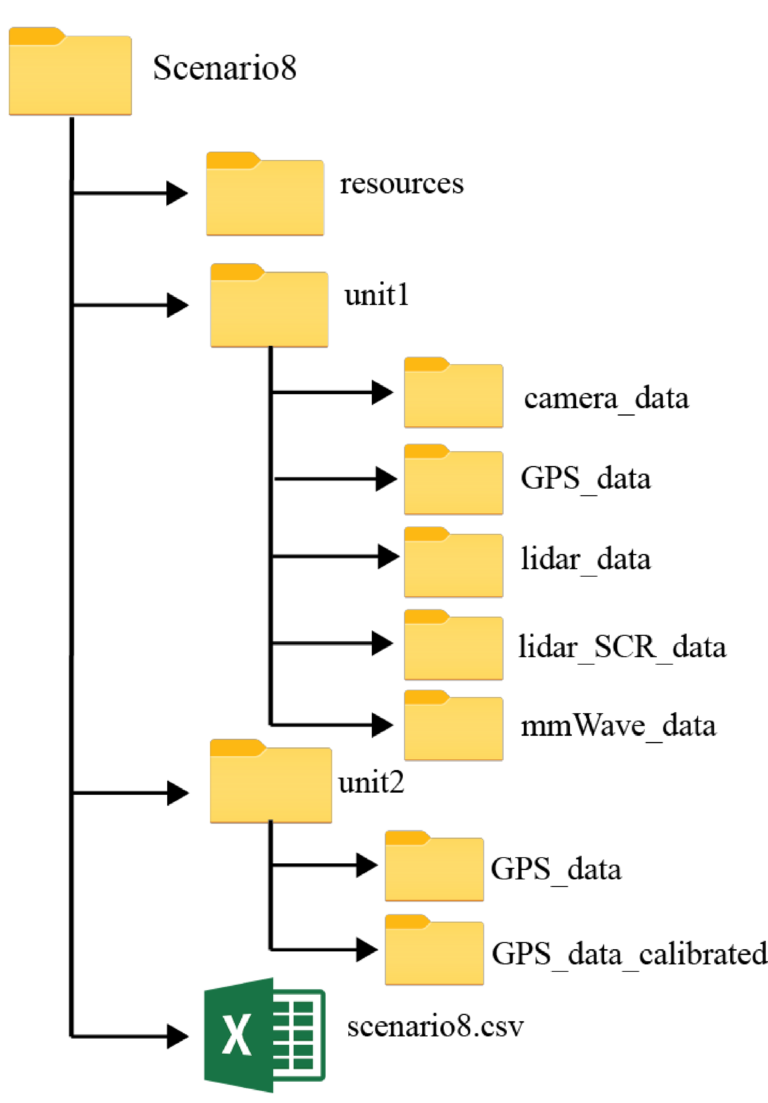
Scenario 8 folder consists of three sub-folders:
- unit1: Includes the data captured by unit 1
- unit2: Includes the data captured by unit 2
- resources: Includes the scenario-specific annotated dataset, data labels and other additional information. For more details, refer the resources section below.
Scenario 8 folder also includes the “scenario 8.csv” file with the paths to all the collected data. For each coherent time, we provide the corresponding visual, wireless and GPS data.
GPS Data Calibration
Why it is needed? Calibration of GPS position (or other modality) is rarely necessary. However, when a sensor reports very low accuracies, it is included a calibrated version for that modality. In this scenario, the GPS error metrics (see PDOP and HDOP in Resources) have considerably higher values than other scenarios. Furthermore, it was noted that the reported positions were off from the group’s experience in the field.
What causes low accuracy or high-error reports? The causes for problematic reports vary and depend on the specific modality. Causes for poor quality GPS are mainly two: i) very high buildings in the surroundings; ii)
What does the Calibration Procedure consist of? To rectify the positions from the actual measurements, we identified on the map the position at which the car always starts, and introduced an offset such that each sequence start at that position.
Where can I find the calibrated data? A calibrated position column called ‘unit2_loc_cal’ will be included in the CSV with the paths to the rectified positions.
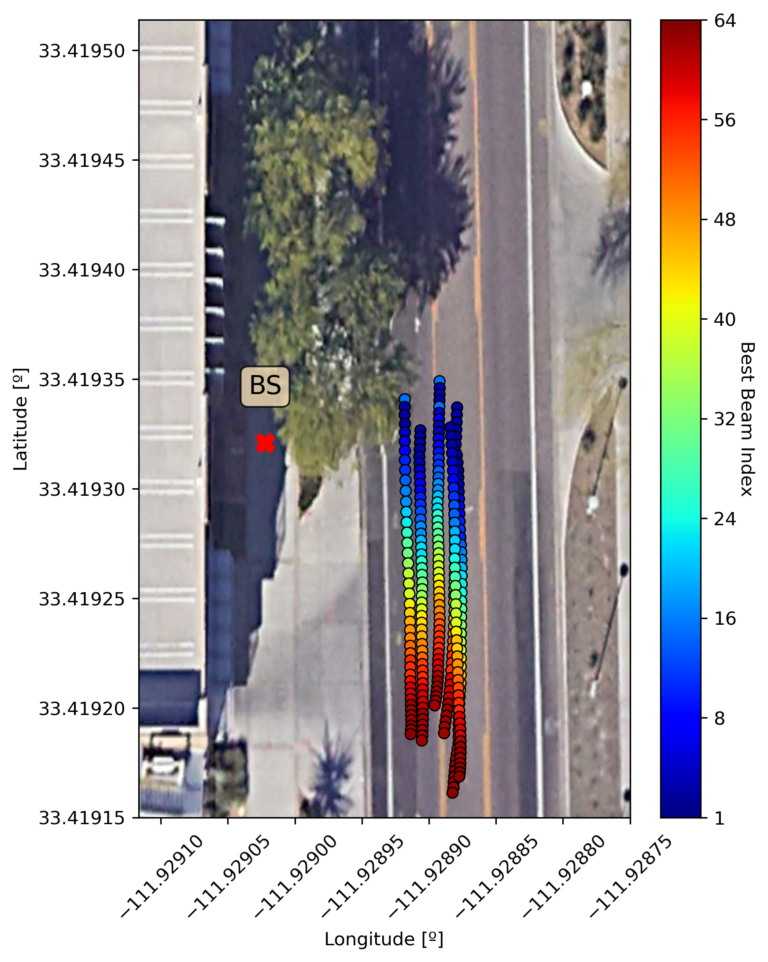
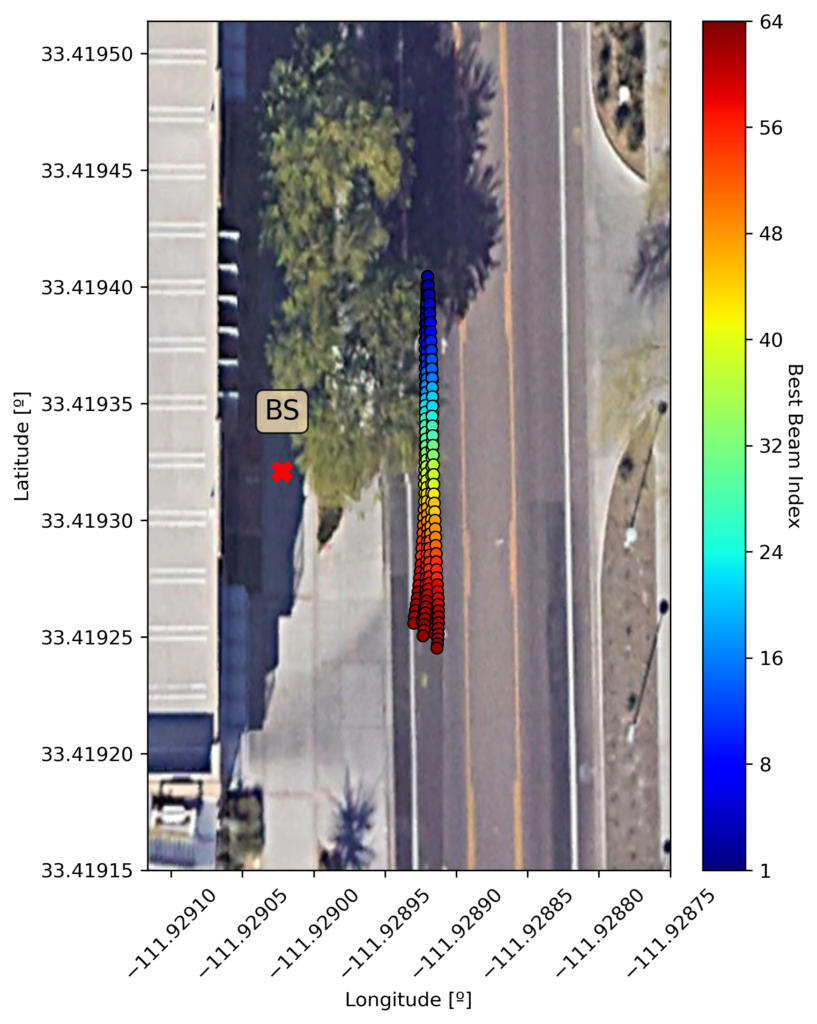
[Before & After] An example of what the calibration method does for correcting the position error:
Before Calibration
After Calibration
Resources
What are the Additional Resources?
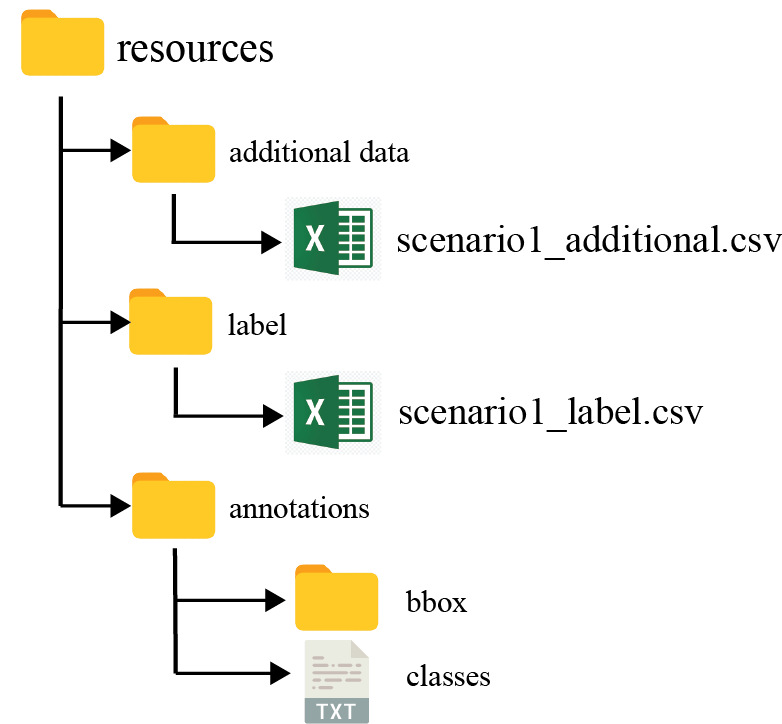
Resources folder consists of the following information:
- annotations: For the visual data, we provide the coordinates of the 2D bounding box and attributes for each frame
- label: This folder includes a CSV file comprising of the ground-truth beam indices computed from the mmWave received power vectors.
- additional data: Includes the scenario-specific additional data. Details of the information is provided below.
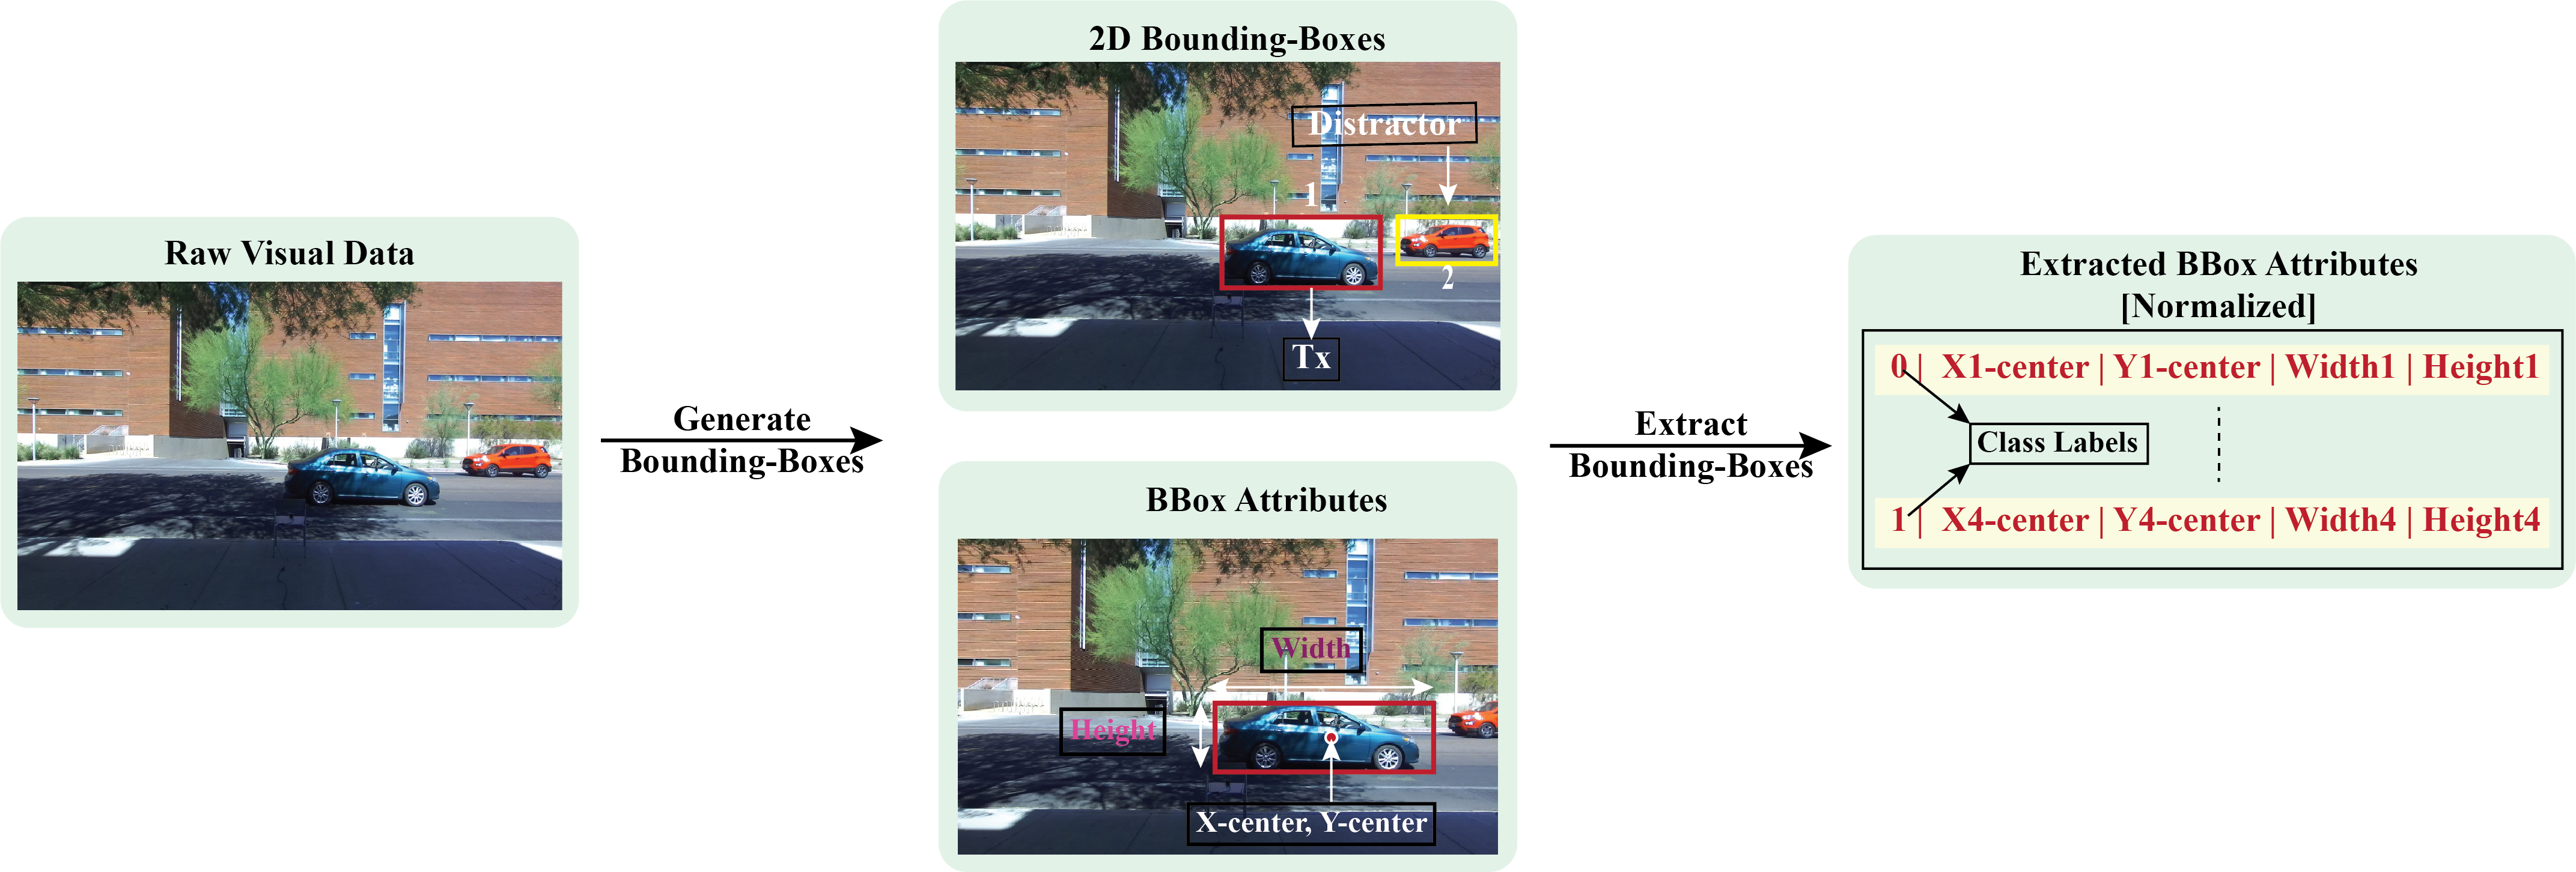
Visual Data Annotations
After performing the post-processing steps presented here, we generate the annotations for the visual data. Using state-of-the-art machine learning algorithms and multiple validation steps, we achieve highly accurate annotations. In this particular scenario, we provide the coordinates of the 2D bounding box and attributes for each frame. We, also, provide the ground-truth labels for 2 object classes, “Tx”, and “Distractor”. The “Tx” refers to the transmitting vehicle in the scene and “Distractor” for any other objects, such as human, other vehicles, etc. We follow the YOLO format for the bounding-box information. In the YOLO format, each bounding box is described by the center coordinates of the box and its width and height. Each number is scaled by the dimensions of the image; therefore, they all range between 0 and 1. Instead of category names, we provide the corresponding integer categories. We follow the following assignment: (i) “Tx” as “0” , and (ii) “Distractor” as “1”.
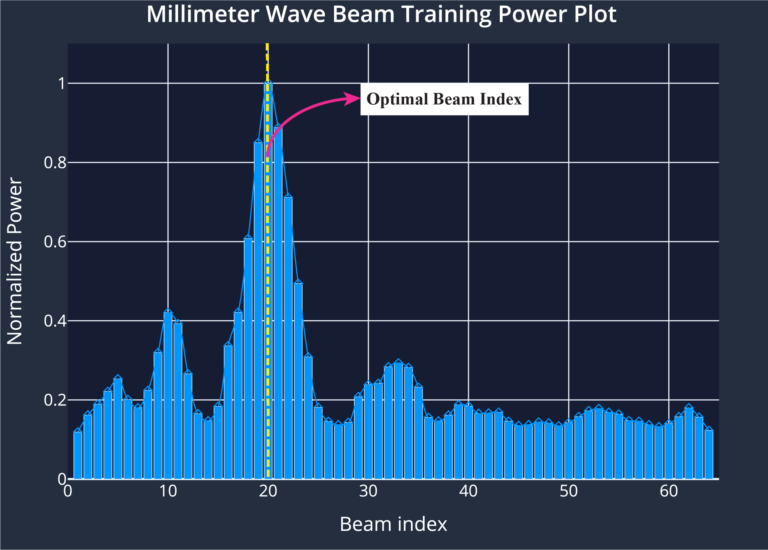
Data Label
The phased array of unit 1 utilizes an over-sampled beamforming codebook of N = 64 vectors, which are designed to cover the field of view. It captures the received power by applying the beamforming codebook elements as a combiner. For each received power vector of dimension [64 x 1], the index with the maximum received power value is selected as the optimal beam index.
Additional Information
We, further, provide additional information for each sample present in the scenario dataset. The details of the additional data is listed below:
- index: It represents the sample number
- seq_index: During the data collection process, the mobile transmitter (unit2) travelled multiple times in front of the base station (unit1). For each run, the testbed collects multiple data samples. All the data samples with the same sequence index belongs to the same run
- time_stamp[UTC]: This represents the time of data capture in “hr-mins-secs-ms” format
- unit2_direction: During the data collection process, the mobile unit generally moves either from left-to-right or right-to-left of the base station. Here “0” represents the left-to-right movement of the transmitter and “1” represents the “right-to-left” movement. The movement is measured is from the point of view of the base station.
- unit2_num_sat: For each data sample, it is an integer value representing the number of connected satellites at that time instant.
- unit2_sat_used: At each time instant, these were the satellites that the receiver was connected
- unit2_fix_type: This shows whether or not there was a 3D fix. A 3D (three dimensional) position fix includes horizontal coordinates plus altitude. It requires a minimum of four visible satellites
- unit2_DGPS: Binary indicator representing whether or not there was Differential GPS was used
- unit2_PDOP: PDOP (position dilution of precision) describes the error caused by the relative position of the GPS satellites.
- unit2_HDOP: HDOP represents the horizontal dilution of precision